末次冰消期气候驱动机制研究——全球末次冰消期冰川10Be 暴露测年综述
【类型】期刊
【作者】李明,周杰,张丽,晏宏,董国成(中国科学院地球环境研究所黄土与第四纪地质国家重点实验室陕西省加速器质谱技术及应用重点实验室;西安加速器质谱中心)
【作者单位】中国科学院地球环境研究所黄土与第四纪地质国家重点实验室陕西省加速器质谱技术及应用重点实验室;西安加速器质谱中心
【刊名】地球环境学报
【关键词】 10Be暴露年龄;末次冰消期;北大西洋冰筏事件;太阳辐射
【资助项】国家重大科学研究计划(2013cb955904);中国博士后科学基金项目(2015m570860)
【ISSN号】1674-9901
【页码】P194-202
【年份】2019
【期号】第3期
【期刊卷】7
【摘要】在第四纪冰期-间冰期的旋回中,寒冷气候的回暖经历了一个长时间过程,而冰消期的时间则相对较短。原地宇宙成因核素10Be可以得到冰川退缩后冰碛物的暴露年龄从而揭示冰期-间冰期演化历史。本文初步总结了末次冰消期附近以10Be暴露测年获得的冰川退却年代,并据此简要讨论末次冰消期的演化过程和驱动机制,包括太阳辐射和北半球巨大冰盖在末次冰消期启动过程中的作用,及其随后崩塌的冰筏对全球海洋和大气环流模式的影响,冰盖融化、海洋上涌产生温室气体与多个正反馈共同推动了冰期的结束。
【全文】 文献传递
末次冰消期气候驱动机制研究
——全球末次冰消期冰川10Be暴露测年综述
摘 要:在第四纪冰期-间冰期的旋回中,寒冷气候的回暖经历了一个长时间过程,而冰消期的时间则相对较短。原地宇宙成因核素10Be可以得到冰川退缩后冰碛物的暴露年龄从而揭示冰期-间冰期演化历史。本文初步总结了末次冰消期附近以10Be暴露测年获得的冰川退却年代,并据此简要讨论末次冰消期的演化过程和驱动机制,包括太阳辐射和北半球巨大冰盖在末次冰消期启动过程中的作用,及其随后崩塌的冰筏对全球海洋和大气环流模式的影响,冰盖融化、海洋上涌产生温室气体与多个正反馈共同推动了冰期的结束。
关键词:10Be暴露年龄;末次冰消期;北大西洋冰筏事件;太阳辐射
利用原地宇宙成因核素10Be可以获得冰川退缩后地表冰碛物的暴露年龄从而揭示冰盖的演化历史(Schäfer et al,1999)。相比于降水的变化,冰川对于温度的变化响应更加灵敏。因此,利用原地宇宙成因核素10Be所获得的暴露年龄是冰川演化的精确年表,同时也是获得地表地貌过程演化和气候突变准确时间的重要依据。同时,冰川作为记录气候演变的一个重要物质载体(Oerlemans,2005),其时空演化特征也是冰期-间冰期旋回驱动研究的重要证据。
在末次冰盛期,巨大冰盖覆盖着北半球中高纬地区,如北美劳伦泰德冰盖、欧洲纳维亚冰盖等。经历了末次冰消期的冰退,直至全新世,北半球冰盖消退至如今的规模。冰盖的进退在冰期-间冰期旋回中具有不对称的特征:降温直至冰盖达到最大规模是一个振荡缓慢的过程,而冰盖的消融过程却相对较短,这种特征在末次冰消期尤为明显。同时,末次冰消期也是人类文明发展的重要阶段,在此期间,海平面上升了120多米,海洋表面温度上升,CO2浓度增加了约100 ppmv(文中ppmv表示mL · m−3)。冰川消退使得山体的侵蚀速率和河流下游的沉积速率发生了巨大改变。末次冰期结束的条件及其机制存在诸多假说。因此,通过汇总末次冰消期冰川10Be暴露测年数据,既能在方法学上避免不一致所导致的误差,又能为末次冰期以来的冰川退却机制提供佐证。这将为进一步讨论南北半球末次冰期结束机制和冰川对气候的响应机制提供重要依据。
1 末次冰消的启动
通过分析全球末次冰消期冰碛物10Be暴露年龄数据,可以获得不同地区的冰退时间,而这些冰退发生的时间正是讨论导致末次冰期结束的重要依据之一(图1)。一个重要的问题就是北大西洋冰筏事件的发生时间。一方面,Denton et al(2010)重提Raymo(1997)所述的北半球冗余冰量是冰筏事件发生的最初原因。劳伦冰盖横跨在北大西洋之上,随着冰量的急剧增加,由重力作用导致冰盖底部压强增加,导致底部冰川向液态水转化,进而使得冰盖的稳定被破坏,当到达临界值时,冰盖发生系统性的崩溃涌入大西洋。据此推测,冰筏碎屑的时间应该是冰量达到临界最大冰量的时间。另一方面,大陆的辐射强迫影响着大气温度(McKinnon et al,2013)。米兰科维奇理论认为,北半球高纬夏季太阳辐射是北半球冰量的主要驱动力,而北半球冰盖受到太阳辐射增加所引发的冰川融化,是全球范围内末次冰期结束的关键(Clark et al,1999;Abe-Ouchi et al,2013)。虽然,Wunsch(2004)认为轨道参数的变化与冰盖体积之间没有统计学上的联系,Broecker(2013)也指出,局地的太阳辐射不是冰川规模的主要驱动力。但是,Roe(2006)证明了冰量变化速率与北半球夏季太阳辐射存在反相关关系。Cheng et al(2009)也进一步阐述了启动机制,当太阳辐射处于低值时,冰量达到了一定范围的值;当太阳辐射进入上升阶段时,太阳辐射加热冰川表面和大洋表面(图2),巨大的冰量也使得冰川与海水的接触面积增大,对太阳辐照的响应更加敏感;随着太阳辐射的不断上升,末次冰消期启动。据此所得到的冰筏事件将是随着太阳辐照上升所发生的一个连续过程。
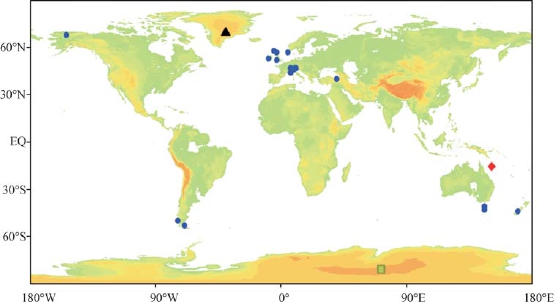
图1 圆点图标为南北半球不同纬度的冰碛物10Be暴露年龄采样点(补充材料),菱形图标为使用不饱和烯酮指标建立起来的南澳大利亚SST采样点(36°44′S,136°3′E)(Calvo et al,2007),三角标图表示GISP2冰芯所获得的格陵兰的温度和冰雪积累速率的采样点(Severinghaus et al,1998),方形图标为在南极洲DOME C中所获得的大气CO2浓度采样点(Marchitto et al,2007)
Fig.1 The dots is the10Be exposure age sample point for the moraine, the diamond icon is the sampling point for SST using the unsaturated ketene indicator in South Australia (36°44′S, 136°3′E) (Calvo et al, 2007), the triangulated plots show the sampling points of the GISP2 ice core with the Greenland’s temperature and ice-snow accumulation rate obtained (Severinghaus et al, 1998), the square icon is the sample site for atmospheric CO2concentrations obtained in Antarctica DOME C (Marchitto et al, 2007)
对于冰筏事件,冰川的退缩与其有着较好的对应关系。Chiang and Bitz(2005)的研究显示,在YD(Younger Dryas,新仙女木事件)和HS1(Heinrich1,海因里希事件)期间,北大西洋冰盖有明显异常增加,同时热带辐合带也在所有的海洋偏离北半球。HS1事件一直是末次冰消期开始时的重要事件,时间(17840 ± 240)a,影响时间是在18 — 14.5 ka(Putnam et al,2013)。查看冰碛物10Be暴露年龄时发现,在大约20 ka BP开始,北半球多地就有冰川退却的报道(图1)。而这一段时间恰恰就在北半球太阳辐射上升而HS1尚未发生的时间段内,当然这些地区不能排除一定程度受降水影响的可能。此外,当HS1发生后,10Be暴露年龄给出的冰退在18 ka之后有着相对集中的出现,即冰退连续发生一直持续至14 ka。Toucanne et al(2009)也记录到来自欧洲冰盖的大规模融水从英吉利海峡涌入北大西洋,最早发生在20000年左右,而在18300年至17000年之间达到最大值。北大西洋极地浮游有孔虫的扩张记录也是在18000年之前(Naughton et al,2009)。这些记录说明末次冰消期开始于北半球夏季日照的大规模增加,太阳辐射在冰消期启动中所起的重要作用是持续且不可忽视的。基于SPECMAP的时间标尺(Imbrie et al,1993)分析得到,冰量变化大约滞后于太阳辐射17 ka,其中在偏心率周期上滞后2000年、斜率7900年、岁差5000年。
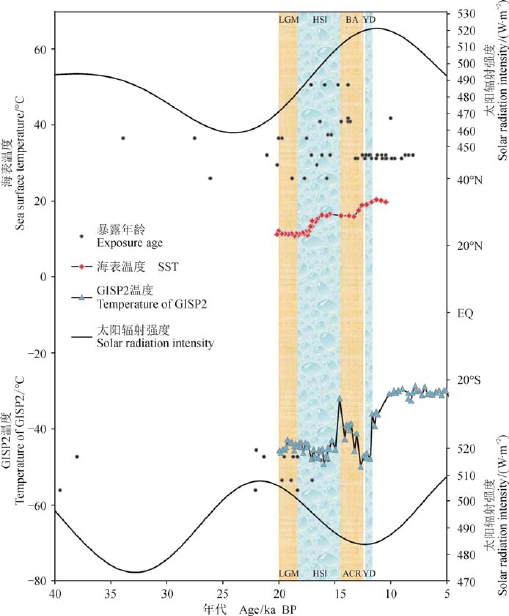
图2 圆点图标为在南北半球不同纬度的冰碛物10Be暴露年龄(补充材料),菱形图标为使用不饱和烯酮指标建立起来的南澳大利亚SST(36°44′S,136°3′E)(Calvo et al,2007),三角标图表示GISP2冰芯所获得的格陵兰的温度(Severinghaus et al,1998),上下实线为6月21日北半球65°N太阳辐射强度和12月21日南半球50°S太阳辐射强度
Fig.2 The dots is the10Be exposure age sample point for the moraine, the diamond icon is the sampling point for SST using the unsaturated ketene indicator in South Australia (Calvo et al, 2007), the triangulated plots show the sampling points of the GISP2 ice core with the Greenland’s temperature (Severinghaus et al, 1998), the upper and lower solid lines are the solar radiation intensity of in the northern hemisphere 65°N on June 21 and the solar radiation intensity of in the southern hemisphere 50°S on December 21
也有观点认为区域性的太阳辐射驱动着南半球第四纪气候变化(Vandergoes et al,2005)。此外,热带海洋研究发现,热带海洋SST(sea surface temperature,海洋表面温度)升高与南极变暖同步并提前于大陆冰量变化约2000 — 3000年(Visser et al,2003))由此提出热带海洋尤其是西太平洋暖池通过与ENSO变化有关的海-气耦合机制驱动着冰期-间冰期气候旋回。基于10Be的暴露年龄数据,南半球的冰退时间与太阳辐射的增强同步(图3),通过对倒数第二次冰期出现时间晚于北半球高纬度夏季太阳辐射的研究,CO2的浓度升高与其存在一定的联系(Henderson and Slowey,2000),使得南半球在23 ka太阳辐射最高值时就不断地出现10Be暴露年龄所指示的冰川退却,并在20 ka之后增多。但是由于缺乏15 ka后的冰川大规模退却的10Be暴露年龄,因此南半球驱动假说难以得到10Be冰川年代学方面的支持,而热带的记录是否是驱动机制还需进一步的研究。
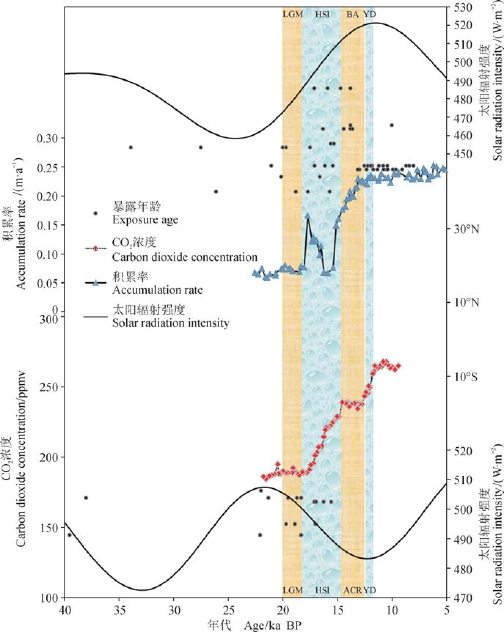
图3 圆点图标为在南北半球不同纬度的冰碛物10Be暴露年龄(补充材料),菱形图标为在南极洲DOME C中所获得的大气CO2浓度(Marchitto et al,2007),三角形图标为GISP2所获得的格陵兰冰雪积累速率(Severinghaus et al,1998),上下实线为6月21日北半球65°N太阳辐射强度和12月21日南半球50°S太阳辐射强度
Fig.3 The dots is the10Be exposure age sample point for the moraine, the diamond icon is the atmospheric carbon dioxide concentration (ppmv) obtained in Antarctica DOME (Marchitto et al, 2007), the triangulated plots show the sampling points of the GISP2 ice core with ice-snow accumulation rate (Severinghaus et al, 1998), the upper and lower solid lines are the solar radiation intensity of in the northern hemisphere 65°N on June 21 and the solar radiation intensity of in the southern hemisphere 50°S on December 21
2 南北半球的相互作用
末次冰盛期的结束,开始于北半球夏季太阳辐射的大规模增加。Henderson and Slowey(2000)指出,南北半球在末次冰盛期结束的过程中都发挥着重要的作用。大量冰川融水汇入北大西洋导致了北大西洋水体的分层(Bard et al,2000;McManus et al,2004)。这种水体的分层减少了北大西洋暖流向北输送的热量,扩大了冬季海冰的范围,导致了北大西洋严重的冰筏事件,并且这种冰筏事件在冬春冰雪消融的时节尤为明显(Denton et al,2005)。在末次冰消期时,这些融水甚至引起了两次北大西洋环流的中断,分别对应是海因里希事件(17.8 — 14.7 ka,HS1)(Barker et al,2009)和新仙女木事件(12.7 —11.7 ka,YD)(Zhou et al,2001)。这两次重要的冰筏事件导致了亚洲夏季风的减弱(Cheng et al,2009),赤道到极地温度梯度的趋缓,从而引发了热带辐合带的南移(Ayliffe et al,2013)以及南半球西风带的南移(Lee et al,2011)。在两次冰筏事件中,亚热带的锋面驱使西风带向极地移动导致了南半球中纬度广大地区的快速升温(Kaplan et al,2010;Putnam et al,2010;De Deckker et al,2012)。极向偏移的南半球西风带导致了绕极环流分层增加和上升流加强,海洋上涌增强,同时极地环流反作用于南大洋,削弱了南大洋的分层使得南大洋海冰覆盖减少从而引发CO2被释放到大气当中(Anderson et al,2009)。增加的大气CO2浓度与北半球夏季太阳辐射一起导致全球回暖,冰川持续融化,并最终促成北半球大冰盖的消失(除格陵兰)(Carlson and Winsor,2012;Shakun et al,2012)。因此,通过这一假说,北大西洋冰筏事件、北大西洋中冷的淡水注入和赤道辐合带(ITCZ)及西风带南移,导致的CO2释放是驱动北半球末次冰消期启动的重要因素,据此假说,冰川退却的时间(10Be暴露年龄)出现在CO2的上升之后更为合理。
Broecker(2013)指出受海洋环流调制的大气CO2浓度既在末次冰期旋回中控制地球冰川和冰盖的物质平衡,也是地球冰期气侯旋回的主要原因。根据Broecker(2013)的假说,在末次冰消期期间,地球上冰川覆盖的范围应该与大气CO2的量对应,是大气中CO2的升高使得南北半球同步,但是这一机制无法解释CO2上升前北半球冰量的变化(图3)。支持太阳辐射的观点认为,太阳辐射的增长是维持冰川消退的关键。不断增长的太阳辐射触发了已经接近静态平衡的巨大冰量向北大西洋快速溶解。这一溶解过程在北半球高纬区下沉抑制了北大西洋深水层水,减弱了大西洋经向翻转环流(AMOC)的作用,进一步减少了热量随北大西洋暖流进入高纬度地区。这种北大西洋冰筏事件所引起的冷事件,通过大气的遥相关作用于亚洲季风(Zhang and Delworth,2005),也使得ITCZ南移(Peterson et al,2000)。由于大气环流模式的向南移动(Wang et al,2007)、南北半球跷跷板的机制(Blunier and Brook,2001)以及CO2的升高导致南极洲的升温。Archer et al(2000)认为没有单一的机制能够解释冰期-间冰期旋回中CO2的上升,而这些机制都是北半球太阳辐射上升所引起的(Severinghaus,2009),多个正反馈共同推动了冰期的结束(Clark et al,2004)。因此,北半球高纬区的65°N太阳辐射被推测是冰消期的根源所在,是轨道缓慢变化引起冰期突变的触发机制,其放大是由多个正反馈机制共同作用完成。其他地区的变化是轨道周期通过北半球高纬区影响的结果。据此假说,10Be测得的冰川退却暴露年代就应当出现在CO2的峰值之前。
根据已见报道的10Be暴露年龄数据(图2),北半球冰退开始于21 — 18 ka,而北半球太阳辐射的增强始于23 ka,CO2上升出现于(17840 ± 240)a(Putnam et al,2010),冰川退却的时间晚于太阳辐射增强,早于CO2的快速增高。南半球末次冰消期第一阶段冰退的10Be暴露年龄集中在22 — 21 ka,此段时间恰逢南半球12月份太阳辐射最强时间,CO2增高后南半球出现了多处冰川退却事件,对此有南北半球大量的10Be暴露年龄报道(图3)。因此,南半球在CO2上升前的冰川退却可能是由于气候带移动所致,而CO2在南北半球的冰川融化发挥了重要作用。此外,值得注意的是,来自石笋的证据表明:最后四次冰消期中(Cheng et al,2009),当太阳辐射的增长速度快时,发生一次冰筏事件就能够完成冰消,如T2、T4;当太阳辐射增长速率不够快时就会出现冰筏事件的中断,即两次冰筏事件,如末次冰消期中(T1),BA事件(Blling-Allerd,BA)出现在HS1事件和YD事件之间;而且当太阳辐射增长不够快、持续时间不够长的时候,类似BA这样的暖事件就会持续超过万年,如BA-Ⅲ。
3 温室气体
古气候记录表明从末次冰盛期(LGM)(22 — 18 ka)到全新世气候回暖的过渡期间,第一次南半球气候变暖事件发生在HS1期间,第二次的变暖事件伴随着YD事件。在北半球的YD和HS1冷事件的期间,南半球由于CO2浓度升高导致温度持续的增加(Monnin et al,2001)。在每一次北半球的冰筏事件中,北大西洋的经向翻转环流减缓或者停顿,亚洲季风减弱、ITCZ南移。相对的,南半球海洋温度上升,CO2含量增加。在HS1发生之后,在南半球多纬度都有冰川退却的10Be暴露年龄的报道(图3)。随着安第斯山岳冰川的大规模消退,夏季智利湖区的大气温度上升了6℃;并且,在50 ka以来,热带雨林首次大规模入侵低地平原地区。在太平洋的两岸,中纬度的SST分两步上升了约5℃(图2)。同样,随后在南半球变冷时,北半球转暖,南北半球之间的表现依然相反。如在Bølling-Allerød暖期,北大西洋经向反转环流恢复,海冰退缩,年平均气温快速回升,亚洲季风加强,赤道辐合带北移;在南半球,南极冷伐事件(ACR)的发生(Shakun et al,2012),与CO2浓度变化相一致,在15 ka左右,冰川的消退几乎停滞(图3),即在南极气候回暖时,有一个冰退的暂停(ACR:14.5 — 12.9 ka),整个过程中南半球的变暖与CO2上升几乎同步。
北大西洋冰筏事件所引起的这些机制与温室气体上升相关的机制很多。首先是气候带的简单南移,如ITCZ的南移(Wang et al,2004)和巴西南部降水的南移(Wang et al,2007),导致了西风的南移(Toggweiler et al,2006),从而在风力的驱动下加强了海洋的上涌,促进海洋中的CO2向大气的释放,由此产生CO2的短暂峰值(Anderson et al,2009)。其次,两极跷跷板在南极的增温促使海冰融化,释放冰盖中的CO2(Keeling and Stephens,2001)。另外,气候带南移使得阿根廷的冰川(Patagonian)退却,降低了粉尘和铁等向南大洋传输的通量,从而降低生物泵的效率(Martin and Fitzwater,1988)。碱性为基础的海洋反馈机制可以解释大范围内的CO2同步上升的现象(Sigman and Boyle,2000),而由冰川退却引起的粉尘通量变化也为这一机制提供了物质基础。另外海平面和大气的CO2对于海洋碱度的反馈也得到了珊瑚礁研究的支持(Opdyke and Walker, 1992)。随着夏季太阳辐射增强,CO2在冰期结束的过程中参与多个正反馈机制,发挥着重要的作用,并最终促成冰川持续融化,北半球大冰盖消失(除格陵兰)(Carlson and Winsor,2012;Shakun et al,2012)。
此外,在YD和HS1作用期间,减弱的AMOC导致海洋热量向北半球输入减少(McManus et al,2004),同时增加了南大洋的海水上涌,并进一步释放CO2(Martinez-Boti et al,2015)。最新的研究显示CO2浓度峰值伴有快速的海洋循环,也就是说在YD和HS1期间AMOC导致的海水上涌之后,CO2浓度迅速回复到了类似现代的水平(Chen et al,2015)。这暗示除冰盖外,海洋是CO2的重要来源之一。热带甲烷产生的峰值也与四次重大的海因里希事件相对应(Rhodes et al,2015)。热带甲烷的峰值通常与该地区降雨量的增加密切相关。Rhodes et al(2015)基于模式模拟当时热带降雨的分布,并提出由海因里希事件而添加到北大西洋中冷的淡水可能削弱了大西洋经向翻转环流,该过程的放缓转而增加了南半球陆地上的降雨,并引起赤道附近甲烷的增加。大批冰山能在500多年的时间中一直漂浮在海上,可以认为海因里希等冰筏事件对气候的影响可能会持续740年至1520年。
4 结论
本文通过对全球末次冰消期冰川冰碛物10Be暴露测年进行简要综述,初步探讨了末次冰消期气候驱动机制研究。末次冰期北半球逐渐形成横跨欧亚美三大洲的巨大的冰盖,当达到一定规模时,南北半球分别在21 ka左右出现局部的冰退现象。在末次冰盛期末,北半球冰盖达到其最大,冰川自身动力增长机制与逐渐增强的北半球夏季太阳辐射,共同作用触发了北大西洋冰筏事件,并在17.8 —14.7 ka留下大规模冰川退却的记录,太阳辐射增长所产生的热量增加不足导致冰筏事件的中断,即形成了两次冰筏事件(HS1和YD)。而大量的陆地冰川熔融的淡水汇入,改变了北大西洋海洋水的垂直分层并阻碍了北大西洋暖流向北的热量输送,并导致ITCZ及西风带的南移。来自海洋、大气的巨大变化也进一步释放了海洋和冰盖中的温室气体,使其参与多个正反馈机制,并最终促成冰川持续融化,北半球大冰盖消失并留下大量冰碛物10Be暴露年代学记录(13 — 10 ka)。
参考文献
Abe-Ouchi A, Saito F, Kawamura K, et al. 2013. Insolationdriven 100,000-year glacial cycles and hysteresis of icesheet volume [J]. Nature, 500: 190 – 194.
Anderson R F, Ali S, Bradtmiller L I, et al. 2009. Wind-driven upwelling in the Southern Ocean and the deglacial rise in atmospheric CO2[J]. Science, 323(5920): 1443 – 1448.
Archer D, Winguth A, Lea D, et al. 2000. What caused the glacial/interglacial atmospheric pCO2cycles? [J]. Reviews of Geophysics, 38(2): 159 – 189.
Ayliffe L K, Gagan M K, Zhao J X, et al. 2013. Rapid interhemispheric climate links via the Australasian monsoon during the last deglaciation [J]. Nature Communications, 4. DOI: 10.10138/ncomms3908.
Bard E, Rostek F, Turon J L, et al. 2000. Hydrological impact of Heinrich events in the subtropical northeast Atlantic [J]. Science, 289(5483): 1321 – 1324.
Barker S, Diz P, Vautravers M J, et al. 2009. Interhemispheric Atlantic seesaw response during the last deglaciation [J]. Nature, 457(7233): 1097 – 1102.
Blunier T, Brook E J. 2001. Timing of millennial-scale climate change in Antarctica and Greenland during the last glacial period [J]. Science, 291(5501): 109 – 112.
Broecker W S. 2013. What drives glacial cycles? [M]. New York: Eldigio Press.
Calvo E, Pelejero C, De Deckker P, et al. 2007. Antarctic deglacial pattern in a 30 kyr record of sea surface temperature offshore South Australia [J]. Geophysical Research Letters, 34, L13707. DOI: 10.1029/2007GL029937.
Carlson A E, Winsor K. 2012. Northern Hemisphere ice-sheet responses to past climate warming [J]. Nature Geoscience, 5: 607 – 613.
Chen T Y, Robinson L F, Burke A, et al. 2015. Synchronous centennial abrupt events in the ocean and atmosphere during the last deglaciation [J]. Science, 349(6255): 1537 – 1541.
Cheng H, Edwards R L, Broecker W S, et al. 2009. Ice age terminations [J]. Science, 326: 248 – 252.
Chiang J C H, Bitz C M. 2005. Infl uence of high latitude ice cover on the marine Intertropical Convergence Zone [J]. Climate Dynamics, 25(5): 477 – 496.
Clark P U, Alley R B, Pollard D. 1999. Northern Hemisphere ice-sheet infl uences on global climate change [J]. Science, 286(5442): 1104 – 1111.
Clark P U, McCabe A M, Mix A C, et al. 2004. Rapid rise of sea level 19,000 years ago and its global implications [J]. Science, 304(5674): 1141 – 1144.
De Deckker P, Moros M, Perner K, et al. 2012. Infl uence of the tropics and southern westerlies on glacial interhemispheric asymmetry [J]. Nature Geoscience, 5: 266 – 269.
Denton G H, Alley R B, Comer G C, et al. 2005. The role of seasonality in abrupt climate change [J]. Quaternary Science Reviews, 24(10 / 11): 1159 – 1182.
Denton G H, Anderson R F, Toggweiler J R, et al. 2010. The Last Glacial Termination [J]. Science, 328(5986): 1652 – 1656.
Henderson G M, Slowey N C. 2000. Evidence from U-Th dating against Northern Hemisphere forcing of the penultimate deglaciation [J]. Nature, 404(6773): 61 – 66.
Imbrie J, Berger A, Boyle E A, et al. 1993. On the structure and origin of major glaciation cycles 2. The 100,000-year cycle [J]. Paleoceanography, 8(6): 699 – 735.
Kaplan M R, Schaefer J M, Denton G H, et al. 2010. Glacier retreat in New Zealand during the Younger Dryas stadial [J]. Nature, 467: 194 – 197.
Keeling R F, Stephens B B. 2001. Antarctic sea ice and the control of Pleistocene climate instability [J]. Paleoceanography, 16(3): 112 – 131.
Lee S Y, Chiang J C H, Matsumoto K, et al. 2011. Southern Ocean wind response to North Atlantic cooling and the rise in atmospheric CO2: Modeling perspective and paleoceanographic implications [J]. Paleoceanography, 26, PA1214. DOI: 10.1029/2010PA002004.
Marchitto T M, Lehman S J, Ortiz J D, et al. 2007. Marine radiocarbon evidence for the mechanism of deglacial atmospheric CO2rise [J]. Science, 316(5830): 1456 – 1459. Martin J H, Fitzwater S E. 1988. Iron-deficiency limits phytoplankton growth in the Northeast Pacifi c subarctic [J]. Nature, 331(6154): 341 – 343.
Martinez-Boti M A, Marino G, Foster G L, et al. 2015. Boron isotope evidence for oceanic carbon dioxide leakage during the last deglaciation [J]. Nature, 518(7538): 219 – 222.
McKinnon K A, Stine A, Huybers P. 2013. The spatial structure of the annual cycle in surface temperature: amplitude, phase, and Lagrangian history [J]. Journal of Climate, 26(20): 7852 – 7862.
McManus J F, Francois R, Gherardi J M, et al. 2004. Collapseand rapid resumption of Atlantic meridional circulation linked to deglacial climate changes [J]. Nature, 428(6985): 834 – 837.
Monnin E, Indermuhle A, Dallenbach A, et al. 2001. Atmospheric CO2concentrations over the last glacial termination [J]. Science, 291(5501): 112 – 114.
Naughton F, Goni M F S, Kageyama M, et al. 2009. Wet to dry climatic trend in north-western Iberia within Heinrich events [J]. Earth and Planetary Science Letters, 284(3 / 4): 329 – 342.
Oerlemans J. 2005. Extracting a climate signal from 169 glacier records [J]. Science, 308(5722): 675 – 677.
Opdyke B N, Walker J C G. 1992. Return of the coral-reef hypothesis: basin to shelf partitioning of CaCO3and its effect on atmospheric CO2[J]. Geology, 20(8): 733 – 736.
Peterson L C, Haug G H, Hughen K A, et al. 2000. Rapid changes in the hydrologic cycle of the tropical Atlantic during the last glacial [J]. Science, 290(5498): 1947 – 1951. Putnam A E, Denton G H, Schaefer J M, et al. 2010. Glacier advance in southern middle latitudes during the Antarctic Cold Reversal [J]. Nature Geoscience, 3: 700 – 704.
Putnam A E, Schaefer J M, Denton G H, et al. 2013. Warming and glacier recession in the Rakaia valley, Southern Alps of New Zealand, during Heinrich Stadial 1 [J]. Earth and Planetary Science Letters, 382: 98 – 110.
Raymo M E. 1997. The timing of major climate terminations [J]. Paleoceanography, 12(4): 577 – 585.
Rhodes R H, Brook E J, Chiang J C H, et al. 2015. Enhanced tropical methane production in response to iceberg discharge in the North Atlantic [J]. Science, 348(6238): 1016 – 1019.
Roe G. 2006. In defense of Milankovitch [J]. Geophysical Research Letters, 3, L24703. DOI: 10.1029/2006GL027817.
Schäfer J M, Ivy-Ochs S, Wieler R, et al. 1999. Cosmogenic noble gas studies in the oldest landscape on earth: surface exposure ages of the Dry Valleys, Antarctica [J]. Earth and Planetary Science Letters, 167(3): 215 – 226.
Severinghaus J P. 2009. Climate change: Southern see-saw seen [J]. Nature, 457(7233): 1093 – 1094.
Severinghaus J P, Sowers T, Brook E J, et al. 1998. Timing of abrupt climate change at the end of the Younger Dryas interval from thermally fractionated gases in polar ice [J]. Nature, 391(6663): 141 – 146.
Shakun J D, Clark P U, Feng H, et al. 2012. Global warming preceded by increasing carbon dioxide concentrations during the last deglaciation [J]. Nature, 484: 49 – 54.
Sigman D M, Boyle E A. 2000. Glacial/interglacial variations in atmospheric carbon dioxide [J]. Nature, 407(6806): 859 – 869. Toggweiler J R, Russell J L,Carson S R. 2006. Midlatitude westerlies, atmospheric CO2, and climate change during the ice ages [J]. Paleoceanography, 21, PA2005. DOI: 10.1029/2005PA001154.
Toucanne S, Zaragosi S, Bourillet J F, et al. 2009. Timing of massive ‘Fleuve Manche’ discharges over the last 350 kyr: insights into the European ice-sheet oscillations and the European drainage network from MIS 10 to 2 [J]. Quaternary Science Reviews, 28(13 / 14): 1238 – 1256.
Vandergoes M J, Newnham R M, Preusser F, et al. 2005. Regional insolation forcing of late Quaternary climate change in the Southern Hemisphere [J]. Nature, 436(7048): 242 – 245.
Visser K, Thunell R, Stott L. 2003. Magnitude and timing of temperature change in the Indo-Pacifi c warm pool during deglaciation [J]. Nature, 421(6919): 152 – 155.
Wang X F, Auler A S, Edwards R L, et al. 2004. Wet periods in northeastern Brazil over the past 210 kyr linked to distant climate anomalies [J]. Nature, 432(7018): 740 – 743.
Wang X F, Auler A S, Edwards R L, et al. 2007. Millennialscale precipitation changes in southern Brazil over the past 90,000 years [J]. Geophysical Research Letters, 34, L23701. DOI: 10.1029/2007GL031149.
Wunsch C. 2004. Quantitative estimate of the Milankovitchforced contribution to observed Quaternary climate change [J]. Quaternary Science Reviews, 23: 1001 – 1012.
Zhang R, Delworth T L. 2005. Simulated tropical response to a substantial weakening of the Atlantic thermohaline circulation [J]. Journal of Climate, 18(12): 1853 – 1860.
Zhou W J, Head M J, An Z S, et al. 2001. Terrestrial evidence for a spatial structure of tropical-polar interconnections during the Younger Dryas episode [J]. Earth and Planetary Science Letters, 191(3): 231 – 239.
Climate mechanism of the Last Glacial Termination — A review of the10Be surface exposure about dating the last deglaciation
Abstract:Background, aim, and scope This review deals with publications concerning the10Be surface exposure dating about the Last Glacial Termination. At the peak of the last ice age, expansive ice sheets covered large areas of the Northern Hemisphere. The reduction of this continental ice to about its present volume represents one of the largest and most rapid natural climate changes in Earth’s recent history. As a consequence, identifying the conditions and processes that triggered this deglaciation has been a major objective of paleoclimate research. Materials and methods The review shows the representative changes in the volume of continental ice throughout the Late Pleistocene.10Be surface exposure dating showing the schematic spatial extent of continental ice sheetat the Last Glacial Termination. Two large ice sheets survived the last termination. One is in Greenland and the other in Antarctica. This review emphasizes the proximity of the Laurentide and European ice sheets to areas of deepwater formation in the North Atlantic Ocean. In the North Atlantic, ice-rafting events indicate the supply of freshwater and icebergs. On the Southern Ocean, the extent of winter sea ice indicates the pattern of the North-South Connections. Results Several publications have been identifi ed show that certain factors and synergism can impact mechanism on and process of the last deglaciation. The ice sheets amount and rate of insolation rise may be important controls on terminations. As a result, Terminations invariably shows began when were at or close the maximum in the rate of insolation rise and their greatest area and volume. Discussion Research on the underlying mechanism of10Be surface exposure about dating the last deglaciation might help to explain some of the effects found in the termination with multiple feedbacks. In general, the rising insolation triggers the initial disintegration of a massive, isostatically compensated ice sheet, which in turn triggers a slowing of meridional overturning circulation (MOC) and hence a lowering of surface-ocean heat flux to the North Atlantic. Along with sea-ice formation, this collapse generates a cold anomaly in the North Atlantic, which weakens the Asian Monsoon through atmospheric teleconnections and also moves the Intertropical Convergence Zone (ITCZ) to the south. Antarctic temperature increase could result from CO2rise, from the bipolar seesaw mechanism, and from southward shifts in atmospheric circulation patterns. Conclusions On the basis of review data, the exposed ages for glacial retreats dated by10Be during the last glacial termination over the world has been reviewed and the process and mechanismon how the last global ice age terminated. North Hemisphere summer insolation intensity and the growth of ice sheet over Northern Hemisphere triggerred the initial retreat of northern ice sheets. Melt water and icebergs entering the North Atlantic altered oceanic and atmospheric circulation and associated fl uxes of heat and carbon, causing increases in atmospheric CO2and Antarctic temperatures. Both rising insolation and CO2concentration drove the termination with multiple positive feedbacks. Recommendations and perspectives If the review is any indication, we have surely not realized the full role of10Be surface exposure dating characterization in the last deglaciation. Developments in10Be surface exposure dating methods are improving the reliability of landscape evolution, glaciation, and paleoclimate interpretations. As more applications are discovered, Quaternary geologists are beginning to address questions that had never before been asked.
Key words:10Be surface exposure dating; last deglaciation; North Atlantic ice-rafting events; solar insolation
Received:Date: 2016-11-15; Accepted Date: 2017-02-14
Foundation Item:National Basic Research Program of China (2013CB955904); China Postdoctoral Science Foundation (2015M570860)
收稿日期:2016-11-15;录用日期:2017-02-14
基金项目:国家重大科学研究计划(2013CB955904);中国博士后科学基金项目(2015M570860)
引用格式:李 明, 周 杰, 张 丽, 等. 2017. 末次冰消期气候驱动机制研究——全球末次冰消期冰川10Be暴露测年综述[J]. 地球环境学报, 8(3): 194 – 202.
Citation:: Li M, Zhou J, Zhang L, et al. 2017. Climate mechanism of the Last Glacial Termination — A review of the10Be surface exposure about dating the last deglaciation [J]. Journal of Earth Environment, 8(3): 194 – 202.