中国西北典型冰川区大气氮素沉降量的估算——以天山乌鲁木齐河源1号冰川为例
【类型】期刊
【作者】王圣杰,张明军,王飞腾,李忠勤(西北师范大学地理与环境科学学院;中国科学院寒区旱区环境与工程研究所冰冻圈科学国家重点实验室/天山冰川站)
【作者单位】西北师范大学地理与环境科学学院;中国科学院寒区旱区环境与工程研究所冰冻圈科学国家重点实验室/天山冰川站
【刊名】生态学报
【关键词】 冰川区;乌鲁木齐河源1号冰川;氮沉降;无机氮;湿沉降
【资助项】国家自然科学基金项目 (41161012,40701035);教育部新世纪优秀人才支持计划项目 (NCET-10-0019);国家重点基础研究发展计划(973)项目 (2010CB951003...
【ISSN号】1000-0933
【页码】P777-785
【年份】2019
【期号】第3期
【期刊卷】1;|7;|8;|4;|5;|2
【摘要】高寒冰川区氮素沉降量的变化会对区域生态系统产生显著影响,定量评估冰川区的氮沉降状况可以为修正相关模型提供重要的原始数据。通过2004年1月至2006年12月在天山乌鲁木齐河源1号冰川连续采样,分析了中国西北典型冰川区大气氮素的沉降特征,并估算了该区域的年均氮素沉降量。研究结果表明,1号冰川湿沉降中的硝态氮(NO-3-N)、铵态氮(NH+4-N)与总无机氮(TIN)存在着明显的季节变化特征:夏季沉降量最大,冬季最少,且与降水量表现出较好的对应关系。1号冰川氮素湿沉降的硝铵比(NO-3-N/NH+4-N)月平均值在0.3—1间波动。1号冰川TIN湿沉降量年平均值为1.51 kg/hm2(其中NH+4-N沉降量占总量的69%,而NO-3-N沉降量仅占31%),干湿沉降总量年均值为1.56 kg/hm2,总氮(TN)的干湿沉降总量年均值为3.85 kg/hm2。得到的冰川区氮素沉降量符合中国西部高寒区的一般水平,代表了该区域的本底值。
【全文】 文献传递
中国西北典型冰川区大气氮素沉降量的估算
——以天山乌鲁木齐河源1号冰川为例
摘要:高寒冰川区氮素沉降量的变化会对区域生态系统产生显著影响,定量评估冰川区的氮沉降状况可以为修正相关模型提供重要的原始数据。通过2004年1月至2006年12月在天山乌鲁木齐河源1号冰川连续采样,分析了中国西北典型冰川区大气氮素的沉降特征,并估算了该区域的年均氮素沉降量。研究结果表明,1号冰川湿沉降中的硝态氮![]() 铵态氮
铵态氮![]() 与总无机氮 (TIN) 存在着明显的季节变化特征:夏季沉降量最大,冬季最少,且与降水量表现出较好的对应关系。1号冰川氮素湿沉降的硝铵比
与总无机氮 (TIN) 存在着明显的季节变化特征:夏季沉降量最大,冬季最少,且与降水量表现出较好的对应关系。1号冰川氮素湿沉降的硝铵比![]() 月平均值在0.3—1间波动。1号冰川TIN湿沉降量年平均值为1.51 kg/hm2 (其中
月平均值在0.3—1间波动。1号冰川TIN湿沉降量年平均值为1.51 kg/hm2 (其中![]() 沉降量占总量的69%,而
沉降量占总量的69%,而![]() 沉降量仅占31%),干湿沉降总量年均值为1.56 kg/hm2,总氮 (TN) 的干湿沉降总量年均值为3.85 kg/hm2。得到的冰川区氮素沉降量符合中国西部高寒区的一般水平,代表了该区域的本底值。
沉降量仅占31%),干湿沉降总量年均值为1.56 kg/hm2,总氮 (TN) 的干湿沉降总量年均值为3.85 kg/hm2。得到的冰川区氮素沉降量符合中国西部高寒区的一般水平,代表了该区域的本底值。
关键词:冰川区;乌鲁木齐河源1号冰川;氮沉降;无机氮;湿沉降
氮的生物地球化学循环对生态环境具有重要的意义[1- 3]。基于定位观测的氮素沉降量估算可以用于验证大气化学传输模型、定量评价氮输入引发的生态效应、推行调控措施以改善环境状况等[4- 5]。随着工农业的发展,包括中国在内的亚洲氮排放量呈现出增长的趋势[6]。然而,目前对氮沉降的研究多集中于中东部地区[7- 8],加强西部地区氮沉降监测,特别是区域本底值监测成为中国氮沉降研究的共识之一[4]。中国西部高寒区氮素沉降量在全国范围内相对较低,因此这一区域氮沉降的变化可能会对生态系统产生更为显著的影响[9- 11]。
相较于其他国家[12- 14]而言,中国西部高寒区的氮沉降研究仍十分有限,特别是对其冰川区氮沉降本底值的认识更是匮乏。1994年中国大气本底基准观象台(瓦里关山本底台)的建立,首次在青藏高原实现了降水化学的长期定位监测[15- 16],此后在西部高寒区其他城镇相继开展了一些研究[17- 19]。贾钧彦等[20- 21]在西藏中东部的林芝、山南、昌都、那曲等四地进行了氮素湿沉降的多年连续监测,发现氮沉降对于西藏这一生态脆弱的区域可能是一笔非常丰厚的外援氮输入。邵伟等[22]研究了西藏林芝地区降雨中有机氮浓度与沉降量的变化特征,发现有机氮也是大气氮沉降的重要组分。肖桐等[5]估算了青藏高原的长江源区氮素沉降量,认为该流域由于降水、径流和输沙作用表现为一个氮源。然而,长期的定位观测一直未真正涉及冰川区,已有的冰川区降水化学观测时段多不足以覆盖全年。在玉龙雪山冰川区开展过全年降水化学研究,但仅注意到了硝态氮的变化特征,对铵态氮并没有报道[23]。高寒冰川区氮素“沉降-消融-径流-参与生态系统”外延的“沉降-迁移-吸收-排放”过程可能对下游生态平衡产生一定的影响,而氮沉降正是这一循环过程中的重要环节,具有潜在的研究价值。此外,对高寒区氮素沉降量的定量评估还可以为典型小流域的高分辨率模拟提供参考依据。天山乌鲁木齐河源1号冰川是中国西北典型的大陆性冰川,具备高寒冰川区氮循环研究的良好条件[24- 28]。本文在前期研究的基础上,通过连续3a的定点采样,结合HYSPLIT气团轨迹模型,进一步丰富对冰川区氮素沉降特征的认识,从而为下游生态平衡评估与未来高寒冰川区高分辨率的模拟研究提供验证。
1 数据与方法
1.1 降水样品采集
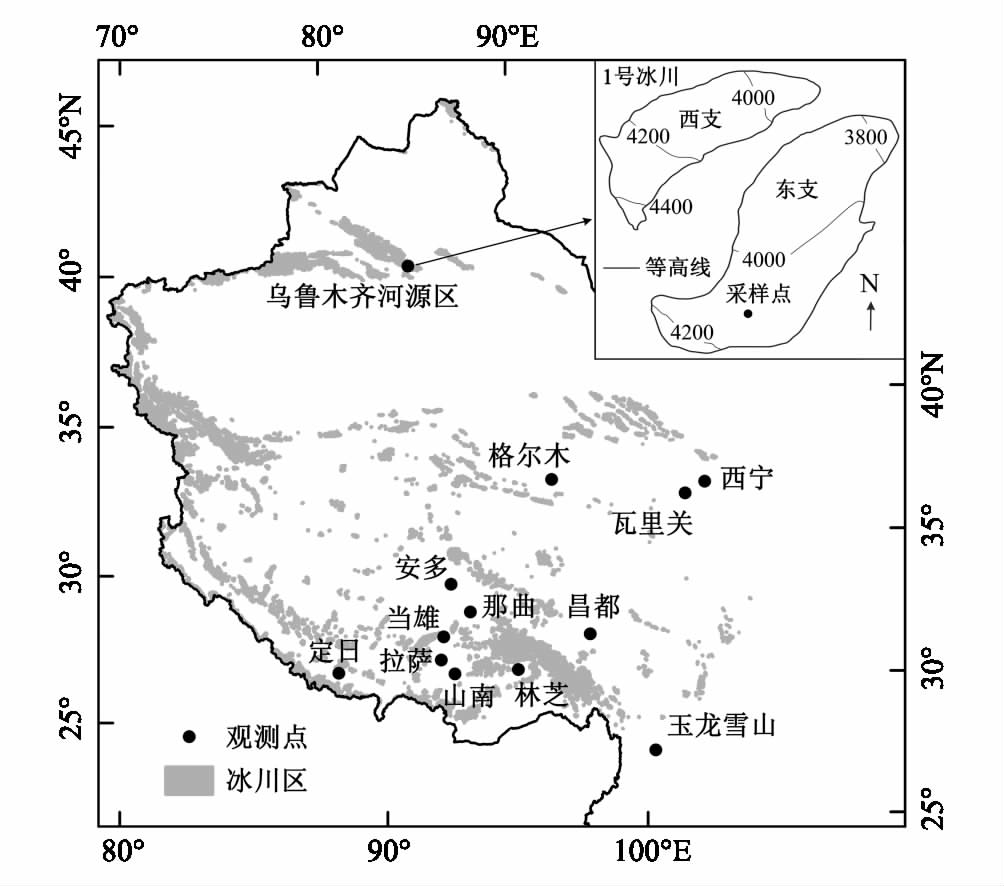
图1 乌鲁木齐河源1号冰川在中国西部高寒区的位置示意图
Fig. 1 Location of Glacier No.1 at the headwaters of Urumqi River in West China
本研究选择天山乌鲁木齐河源1号冰川东支积累区海拔4130 m处 (43°06′N,86°49′E) 作为采样点 (图1)。该采样点的降水以固态为主,因此以冰川表面未受后沉积作用影响的新雪样品代表降水。自2004年1月至2006年12月,每周在采样点进行一次定位考察,若有新降雪出现则采集样品,共得到66个新雪样品。雪样在采集和运输过程中均采取严格的操作规范,样品密封后,在冰冻状态下从野外运回中国科学院寒区旱区环境与工程研究所天山冰川观测试验站实验室后低温保存直至实验分析。
1.2 化学分析
离子色谱法已被广泛运用于水体中氮素的测试[29- 31]。本研究采用Dionex- 320型离子色谱仪测定样品中![]() 与
与![]() 的浓度[32],从而得到硝态氮
的浓度[32],从而得到硝态氮![]() 与铵态氮
与铵态氮![]() 与
与![]() 和
和![]() 相比,雪样中
相比,雪样中![]() 含量极小[33],故本研究未对
含量极小[33],故本研究未对![]() 进行分析。因此,湿沉降中的总无机氮 (TIN) 沉降量为
进行分析。因此,湿沉降中的总无机氮 (TIN) 沉降量为![]() 和
和![]() 沉降量之和,即
沉降量之和,即![]() 此外,参考相关文献中有关西部高寒区氮素干沉降/湿沉降的比例[19]和无机氮/有机氮 (TIN/TON)[21]的比例,对干湿沉降的总氮 (TN = TIN + TON) 进行了估算。
此外,参考相关文献中有关西部高寒区氮素干沉降/湿沉降的比例[19]和无机氮/有机氮 (TIN/TON)[21]的比例,对干湿沉降的总氮 (TN = TIN + TON) 进行了估算。
1.3 气象观测资料
采样点的降水量根据大西沟气象站 (43°06′N,86°50′E,距1号冰川末端3 km) 实测数据进行误差修正后按照降水量的垂直递变率推算得到。详细的修正与推算方法参见杨大庆等[34]在乌鲁木齐河源区的研究。
2 结果与讨论
2.1 氮素湿沉降量的季节变化特征
根据2004—2006年连续采样的实验分析结果,乌鲁木齐河源1号冰川积累区湿沉降中的![]() 与TIN均存在着明显的季节变化特征 (图2)。1—4月氮素的湿沉降量平均值相对较低,直到5月才开始迅速增加。4月的TIN湿沉降量多年平均值仅为0.05 kg/hm2,而5月的已升至0.24 kg/hm2,是4月的4.5倍;从4月到5月,
与TIN均存在着明显的季节变化特征 (图2)。1—4月氮素的湿沉降量平均值相对较低,直到5月才开始迅速增加。4月的TIN湿沉降量多年平均值仅为0.05 kg/hm2,而5月的已升至0.24 kg/hm2,是4月的4.5倍;从4月到5月,![]() 与
与![]() 湿沉降量多年平均值相应地分别增大了6.4与3.9倍。5—9月氮素的湿沉降量虽然存在着一定程度的波动,但是一直维持在相对较高的水平
湿沉降量多年平均值相应地分别增大了6.4与3.9倍。5—9月氮素的湿沉降量虽然存在着一定程度的波动,但是一直维持在相对较高的水平![]() 的月沉降量多年平均值不小于
的月沉降量多年平均值不小于![]() 的月沉降量平均值不小于0.13 kg/hm2,TIN的月沉降量平均值不小于0.17 kg/hm2)。从10月开始,氮素沉降量突然下降。TIN平均值从9月的0.23 kg/hm2降至10月的0.07 kg/hm2,降幅为69%;
的月沉降量平均值不小于0.13 kg/hm2,TIN的月沉降量平均值不小于0.17 kg/hm2)。从10月开始,氮素沉降量突然下降。TIN平均值从9月的0.23 kg/hm2降至10月的0.07 kg/hm2,降幅为69%;![]() 与
与![]() 分别减小了0.05 kg/hm2与0.11 kg/hm2,降幅分别为68%、69%。10—12月,氮素沉降量维持在较低的水平,数量水平与1—4月类似。通过表1可以发现绝大部分氮素的湿沉降都发生在夏季。以TIN为例,有54%的湿沉降发生在夏季,其次是秋季 (22%) 与春季 (21%),冬季最少 (2%)
分别减小了0.05 kg/hm2与0.11 kg/hm2,降幅分别为68%、69%。10—12月,氮素沉降量维持在较低的水平,数量水平与1—4月类似。通过表1可以发现绝大部分氮素的湿沉降都发生在夏季。以TIN为例,有54%的湿沉降发生在夏季,其次是秋季 (22%) 与春季 (21%),冬季最少 (2%)![]() 沉降的季节分布格局与之相似,夏季的湿沉降量分别占到全年湿沉降量的52%与55%。夏季降水最多,其冲刷作用较强,尽管降水量最多的时段往往氮素浓度较小,但氮素的湿沉降量依然较大;春秋季节降水量相差不大,但是湿沉降中氮素浓度较高,氮素沉降量低于夏季的;冬季降水量很少,与其他季节有数量级的差异,大气中的氮素无法被淋洗因此沉降量最低[21]。
沉降的季节分布格局与之相似,夏季的湿沉降量分别占到全年湿沉降量的52%与55%。夏季降水最多,其冲刷作用较强,尽管降水量最多的时段往往氮素浓度较小,但氮素的湿沉降量依然较大;春秋季节降水量相差不大,但是湿沉降中氮素浓度较高,氮素沉降量低于夏季的;冬季降水量很少,与其他季节有数量级的差异,大气中的氮素无法被淋洗因此沉降量最低[21]。
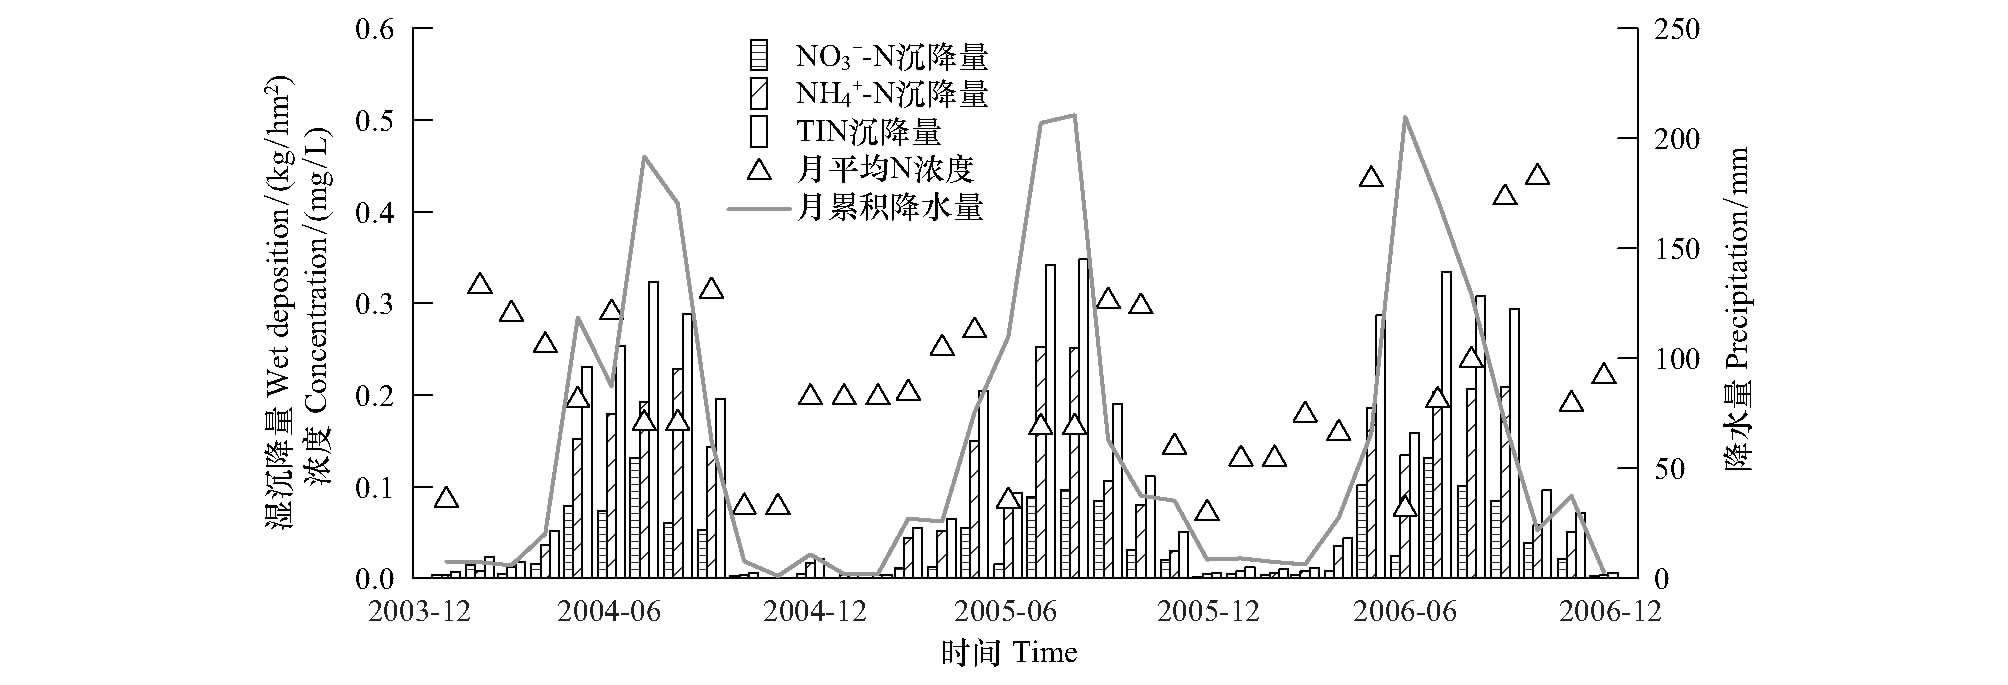
图2 2004—2006年![]() 与TIN湿沉降量以及月平均N浓度、月累积降水量
与TIN湿沉降量以及月平均N浓度、月累积降水量
Fig. 2 Monthly wet deposition of ![]() , N
, N![]() -N and TIN, mean nitrogen concentration, and accumulated precipitation during 2004—2006
-N and TIN, mean nitrogen concentration, and accumulated precipitation during 2004—2006
表1 2004—2006年降水量与![]() 与TIN湿沉降量的四季分布
与TIN湿沉降量的四季分布
Table 1 Seasonal distribution of precipitation and wet deposition of ![]() , N
, N![]() -N and TIN during 2004—2006
-N and TIN during 2004—2006
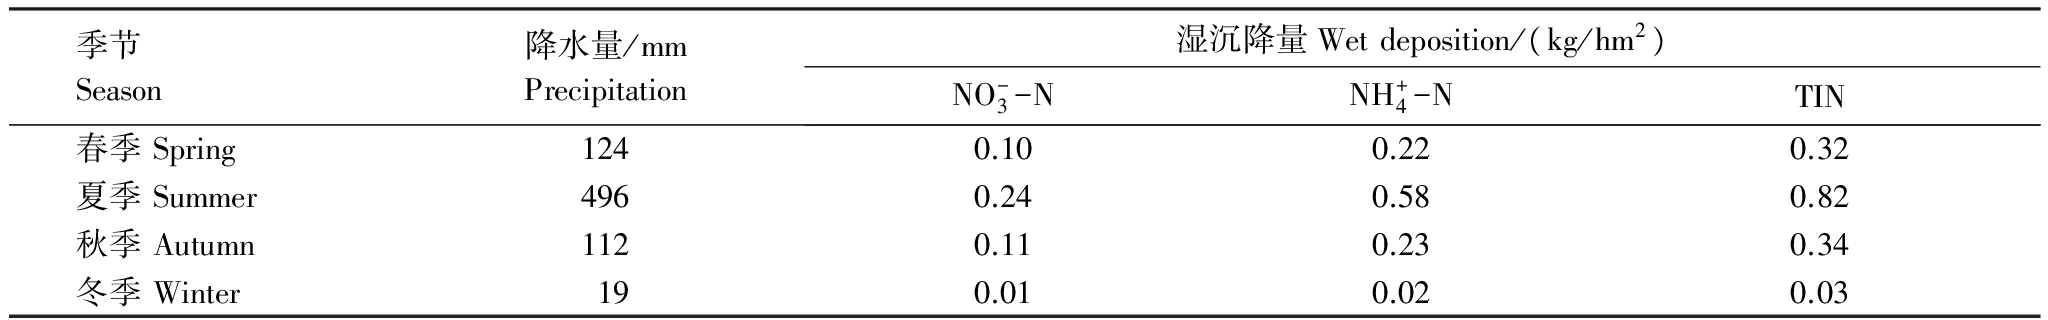
季节Season降水量/mmPrecipitation湿沉降量Wetdeposition/(kg/hm2)NO-3-NNH+4-NTIN春季Spring1240.100.220.32夏季Summer4960.240.580.82秋季Autumn1120.110.230.34冬季Winter190.010.020.03
对比降水量发现,氮素的湿沉降量与降水量存在着较好的对应关系。5月之后氮素沉降量的增加,是在降水量同期增加下产生的。当降水量较为充沛,氮素沉降量也较为丰富,反之亦然。根据采样点降水量的变化情况,可以将研究时段划分为湿季与干季:湿季为4—10月,干季为11月—翌年3月[35]。对干湿季的氮素湿沉降量差异进行比较,可以更为清楚地发现这一对应关系 (图3)。根据2004—2006年间的气象记录,湿季降水量占92%,干季降水量很少,仅为8%。而湿季氮素的湿沉降量显著高于干季,各形态氮![]() 及TIN沉降量均为全年湿沉降总量的93%以上。相关性分析的结果也表明,月尺度下降水量与
及TIN沉降量均为全年湿沉降总量的93%以上。相关性分析的结果也表明,月尺度下降水量与![]() 沉降量的相关系数分别为0.77、0.88与0.86,均通过了显著性水平为0.01的检验。
沉降量的相关系数分别为0.77、0.88与0.86,均通过了显著性水平为0.01的检验。
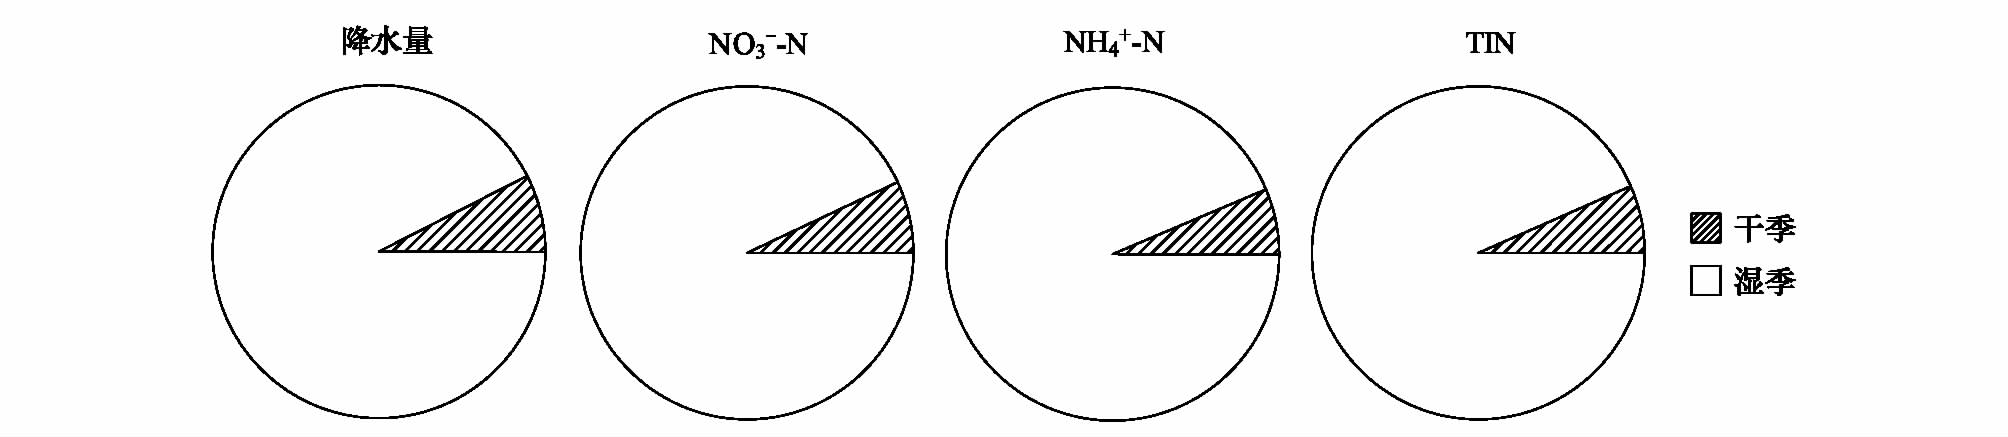
图3 2004—2006年降水量![]() 与TIN湿沉降量的干湿季分布
与TIN湿沉降量的干湿季分布
Fig. 3 Comparisons of precipitation, wet deposition of ![]() , N
, N![]() -N and TIN in the dry/wet season during 2004—2006
-N and TIN in the dry/wet season during 2004—2006
2.2 湿沉降中氮素的方向来源分析
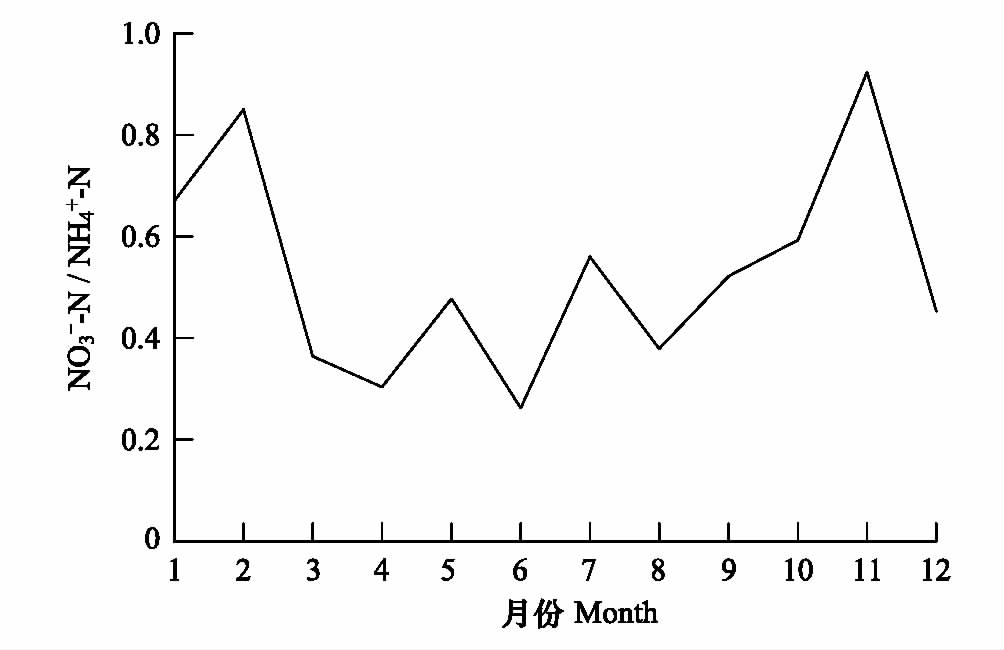
图4 2004—2006年湿沉降中硝铵比的月变化
Fig. 4 Monthly variation of ![]() / N
/ N![]() -N in wet deposition during 2004—2006
-N in wet deposition during 2004—2006
不同形态氮沉降量相对比例的变化可以反映出氮素的不同来源[21,36]。根据连续的3a记录 (图4),大多数月份的硝铵比 (即![]() 都在0.3—0.7间波动,仅干季2、11月的略高,分别为0.85和0.92。这一季节变化一方面受到局地排放的影响,另一方面也受到大气输送的影响。虽然本研究缺乏局地排放量的月数据,但是氮素排放量的季节变化已经多有报道,气温较低的时段一般NH3排放量较小[37]。
都在0.3—0.7间波动,仅干季2、11月的略高,分别为0.85和0.92。这一季节变化一方面受到局地排放的影响,另一方面也受到大气输送的影响。虽然本研究缺乏局地排放量的月数据,但是氮素排放量的季节变化已经多有报道,气温较低的时段一般NH3排放量较小[37]。
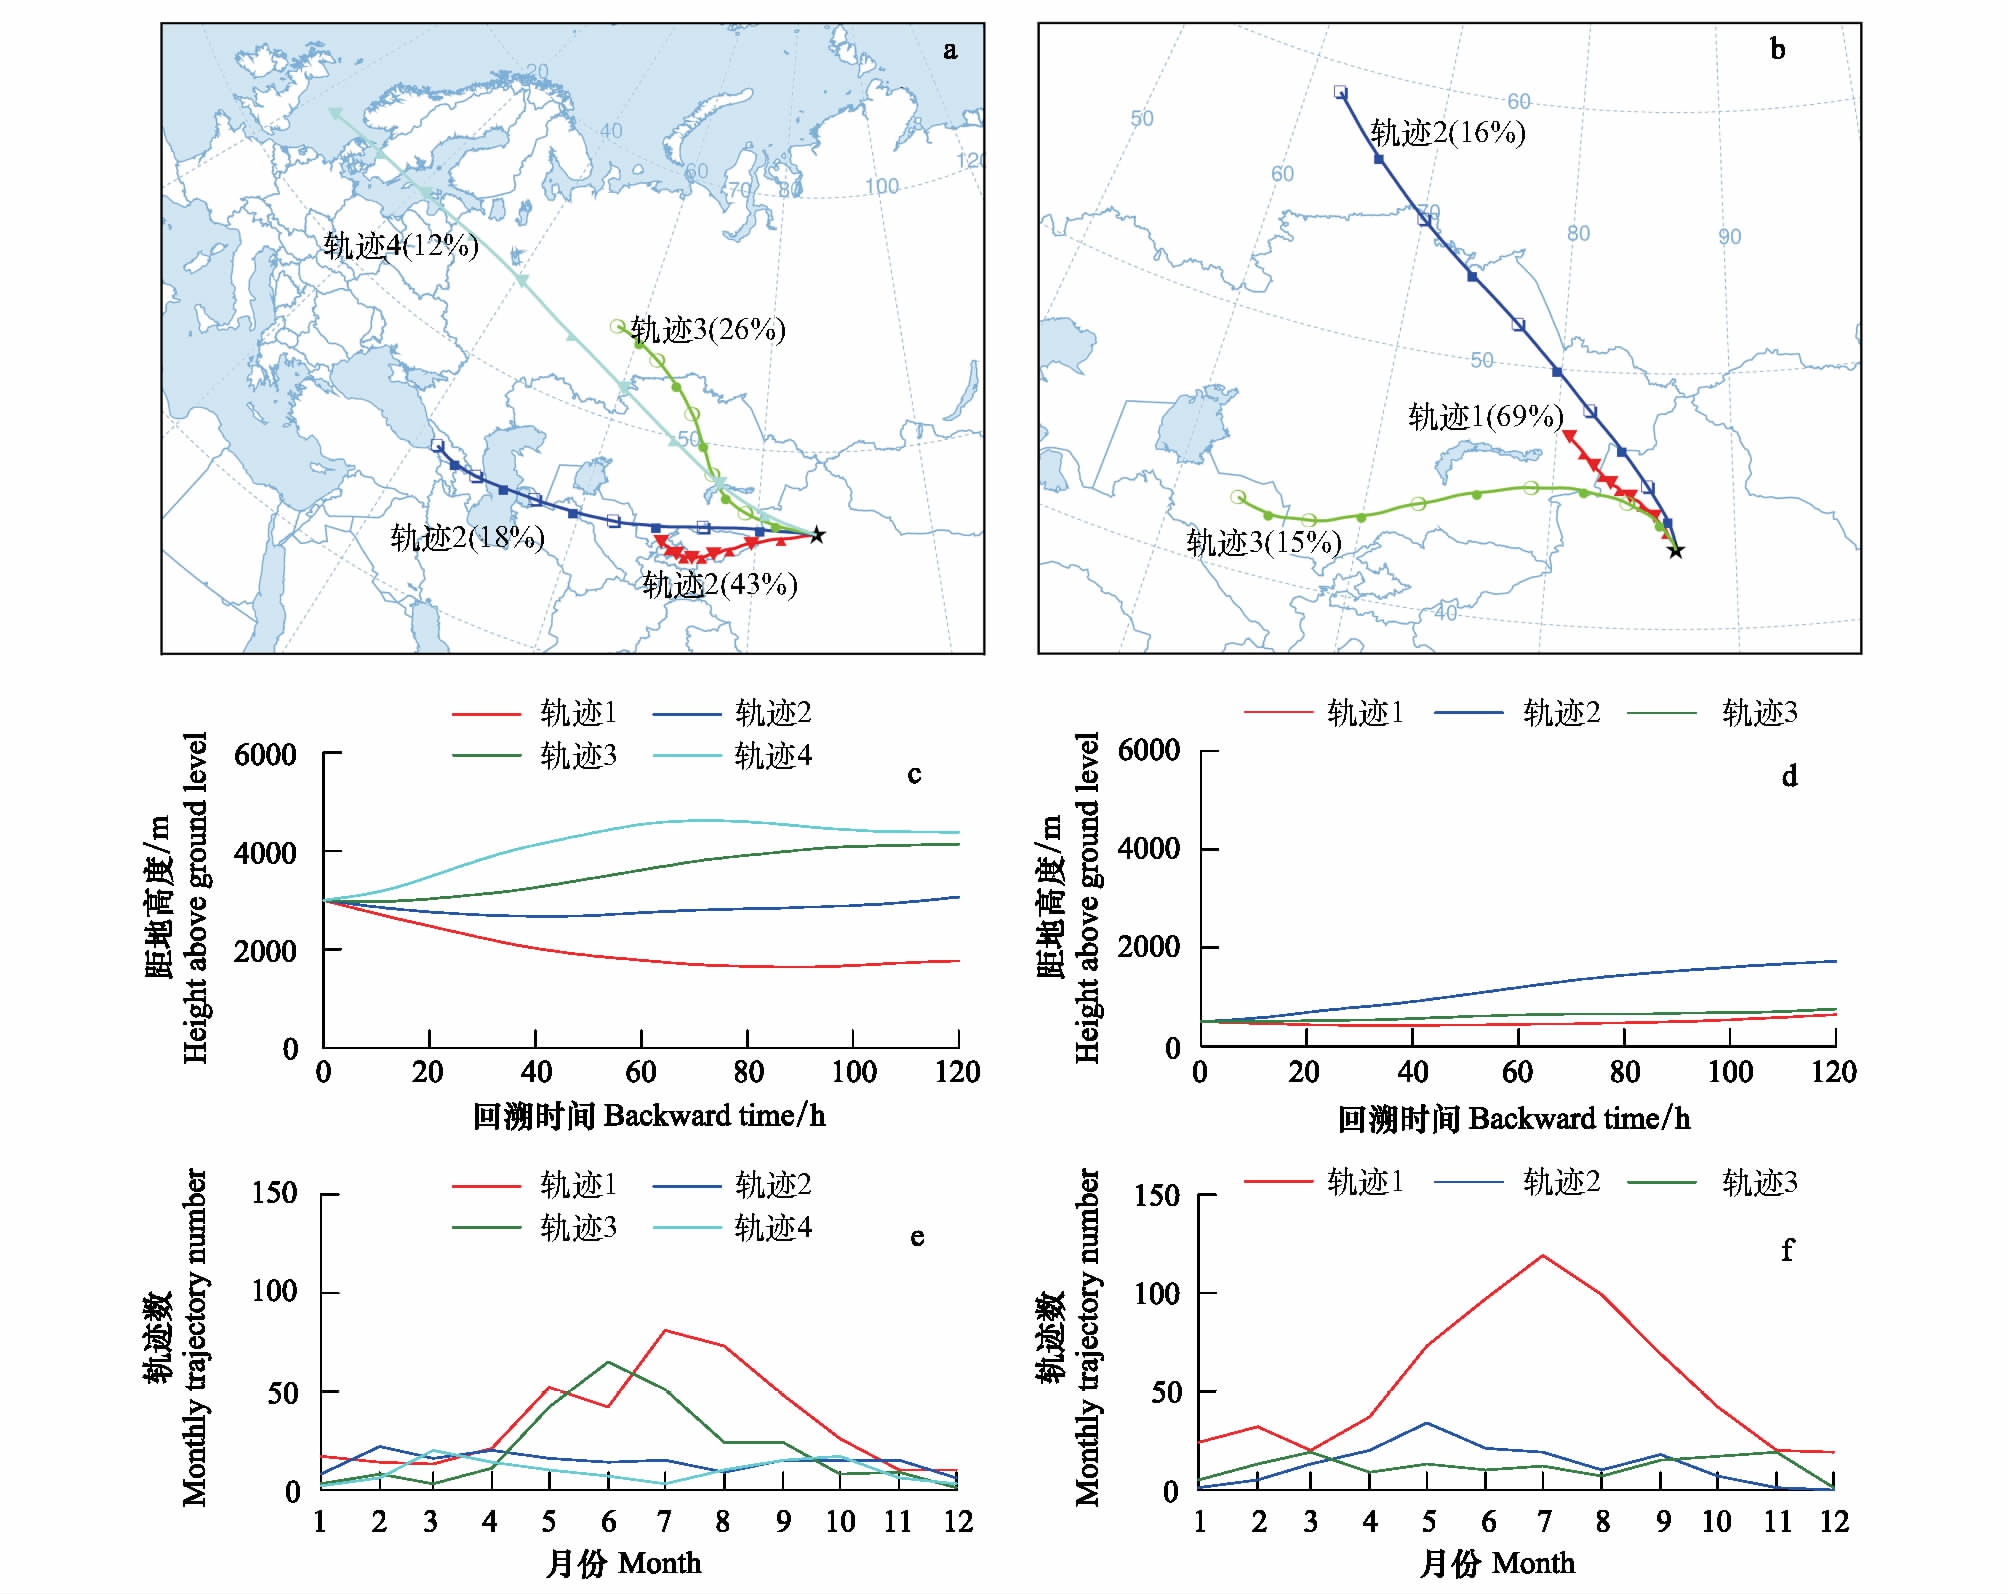
图5 2004—2006年降水日高空云团 (a、c、e) 与云下气团 (b、d、f) 后向轨迹聚类平均图、运动高度与月份分布
Fig. 5 Cluster mean backward trajectory and its modeled movement height and monthly distribution of superior air mass (a, c, e) and air mass under clouds (b, d, f) in precipitation days during 2004—2006
研究表明空气轨迹模式可以反映出不同尺度上 (高空云团与云下气团) 氮素的传输过程[27,30- 31],因此本研究利用美国国家海洋与大气管理局 (NOAA) 空气资源实验室 (ARL) 开发的混合单粒子拉格朗日积分轨迹模式HYSPLIT 4.9来回溯其气团源地。该模式使用的气象资料根据美国国家环境预报中心/美国国家大气研究中心 (NCEP/NCAR) 的全球再分析资料 (global reanalysis) 处理获得,空间分辨率为2.5°×2.5°,由NOAA提供。本研究分别使用3000 m与500 m作为起算高度,代表高空云团与云下气团[30- 31],计算2004—2006年间所有降水日 (日降水量≥0.1 mm) 逐日8:00与20:00的120 h后向轨迹,并进行聚类平均分析。气团后向轨迹模拟结果 (图5) 显示,高空云团与云下气团的传输路径仍是相似的,差异主要表现在传输距离上,这与中国东南沿海地区[30- 31]存在着很大的不同。根据气团后向轨迹的聚类平均值,采样点气团均主要来自西北向与西向。其中,高空云团 (图5a、c、e) 轨迹1与轨迹3在湿季更为显著,轨迹2与轨迹4的季节差异相对较小,从硝铵比相对较高的干季来看,轨迹1与轨迹2可能是其主要气团来源;云下气团 (图5b、d、f)轨迹1在湿季更为显著,轨迹2与轨迹3的季节差异相对较小,干季轨迹1可能仍是其主要气团来源。考虑到含氮物质在大气中的存在时间,大气传输对氮素沉降量应存在着一定程度的影响。
2.3 氮素沉降量年均值的估算
根据对不同年度氮素湿沉降量的对比,发现2004—2006年间湿沉降中氮素的年际间变化幅度相对较小 (图6)。没有明显的年际变化也表明该冰川区的降水气团来源较为稳定。TIN在2004、2005、2006年的湿沉降量分别为1.42、1.47、1.63 kg/hm2;![]() 与
与![]() 的年际间沉降量变化趋势与TIN的类似。因此,采样期3年的平均值可以代表氮素沉降量的一般水平,采样点TIN湿沉降量多年平均值为1.51 kg/hm2。湿沉降中
的年际间沉降量变化趋势与TIN的类似。因此,采样期3年的平均值可以代表氮素沉降量的一般水平,采样点TIN湿沉降量多年平均值为1.51 kg/hm2。湿沉降中![]() 占绝对优势,其沉降量占总量的69% (1.04 kg/hm2),而
占绝对优势,其沉降量占总量的69% (1.04 kg/hm2),而![]() 沉降量仅占31% (0.46 kg/hm2)。
沉降量仅占31% (0.46 kg/hm2)。
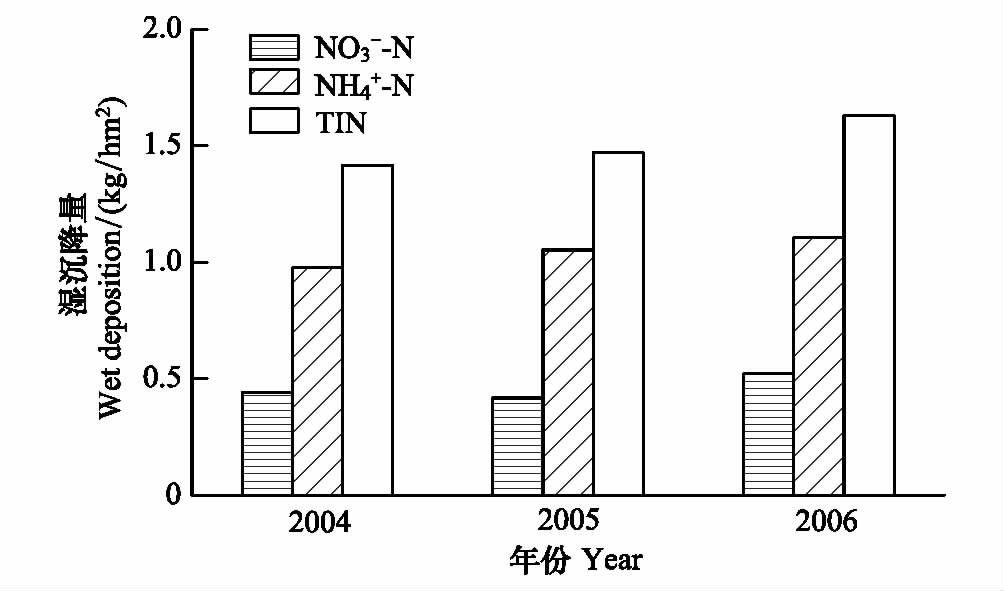
图6 2004—2006年![]() 与TIN湿沉降量的年际间变化
与TIN湿沉降量的年际间变化
Fig. 6 Interannual variability of ![]() , N
, N![]() -N and TIN deposition during 2004—2006
-N and TIN deposition during 2004—2006
本研究虽然仅统计了氮素的湿沉降量,但其干沉降量仍是不容忽视的。在缺乏实测资料的基础上,不少研究通过干湿沉降的比例来估算干沉降量。然而不同区域氮素的干湿沉降比例往往存在很大的差别,这与气象气候条件、采样方法、计算依据等因素都有关系。根据之前对乌鲁木齐河源高山区 (43°06′N,86°50′E) 降水的研究,该区域含氮离子以湿沉降为主,![]() 的干沉降量占其干湿沉降总量的6%,而
的干沉降量占其干湿沉降总量的6%,而![]() 的干沉降量占总沉降量的3%[19]。按照这一比例估算出TIN的干沉降量年均值为0.06 kg/hm2,其中
的干沉降量占总沉降量的3%[19]。按照这一比例估算出TIN的干沉降量年均值为0.06 kg/hm2,其中![]() 与
与![]() 沉降量各占一半。也就是说,TIN的干湿沉降总量年均值为1.56 kg/hm2,其中,
沉降量各占一半。也就是说,TIN的干湿沉降总量年均值为1.56 kg/hm2,其中,![]() 与
与![]() 沉降量分别占31% (0.49 kg/hm2) 与69% (1.07 kg/hm2)。如果要进一步估算该区域的总氮 (TN) 沉降量,则需要考虑总有机氮 (TON)。参考在西藏中东部的研究[21] (即TON对TN的贡献率为59%) 可得,TON的干湿沉降总量年均值为2.29 kg/hm2,TN的干湿沉降总量年均值为3.85 kg/hm2。
沉降量分别占31% (0.49 kg/hm2) 与69% (1.07 kg/hm2)。如果要进一步估算该区域的总氮 (TN) 沉降量,则需要考虑总有机氮 (TON)。参考在西藏中东部的研究[21] (即TON对TN的贡献率为59%) 可得,TON的干湿沉降总量年均值为2.29 kg/hm2,TN的干湿沉降总量年均值为3.85 kg/hm2。
在没有人类活动影响的情况下,生态系统中氮素沉降量年均值仅约为0.5 kg/hm2甚至更小[1,38]。然而,受到人类活动的强烈影响,我国中东部的氮素湿沉降量一般都远大于上述数值,甚至有2个数量级的差异。西部高寒区人口分布较少,受工农业影响也比中东部小得多,可以代表该区域大气湿沉降的本底值。模拟结果显示西部高寒区氮素沉降量在全国范围内应处于较低的水平[11],但对于这一区域氮素湿沉降量的长期实测数据仍很有限[21] (图1,表2)。综合考虑西部高寒区的空间范围与降水量的差异,本研究估算的乌鲁木齐河源1号冰川氮素沉降量是基本合理的,符合中国西部高寒区的一般水平。
3 结论
本研究通过对天山乌鲁木齐河源1号冰川连续3a采样,分析了西北典型冰川区大气氮素沉降特征,估算了该区域年均氮素沉降量。
(1) 乌鲁木齐河源1号冰川湿沉降中的![]() 与TIN均存在着明显的季节变化特征。1—4月氮素沉降量相对较低,5月以后开始迅速增加,5—9月间虽然有波动但维持在相对较高的水平,10月以后突然下降,10—12月沉降量较低。若按照四季划分,则夏季氮沉降量最大,冬季最少,乌鲁木齐河源1号冰川氮素沉降量与降水量存在着较好的对应关系。
与TIN均存在着明显的季节变化特征。1—4月氮素沉降量相对较低,5月以后开始迅速增加,5—9月间虽然有波动但维持在相对较高的水平,10月以后突然下降,10—12月沉降量较低。若按照四季划分,则夏季氮沉降量最大,冬季最少,乌鲁木齐河源1号冰川氮素沉降量与降水量存在着较好的对应关系。
表2 中国西部高寒区TIN与TN大气沉降量的对比
Table 2 Comparisons of TIN and TN deposition in the cold regions over West China
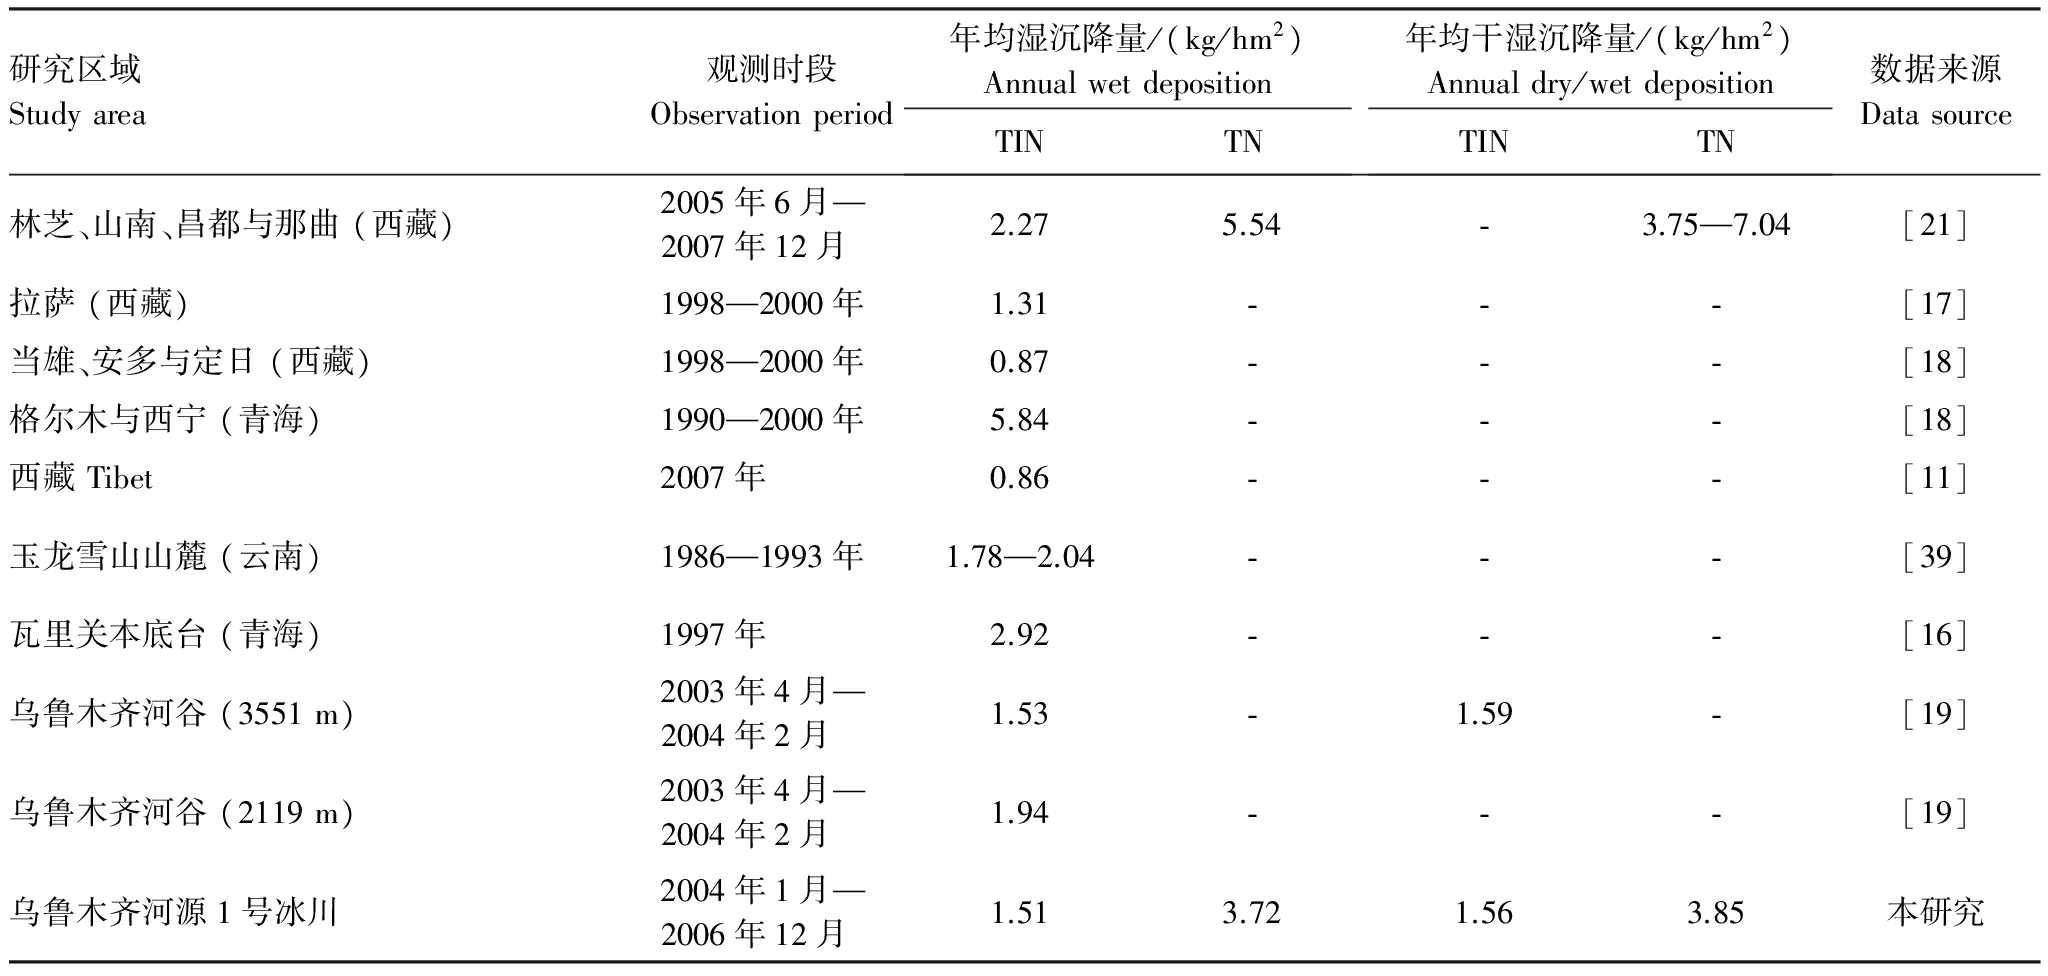
研究区域Studyarea观测时段Observationperiod年均湿沉降量/(kg/hm2)AnnualwetdepositionTINTN年均干湿沉降量/(kg/hm2)Annualdry/wetdepositionTINTN数据来源Datasource林芝、山南、昌都与那曲(西藏)2005年6月—2007年12月2.275.54⁃3.75—7.04[21]拉萨(西藏)1998—2000年1.31⁃⁃⁃[17]当雄、安多与定日(西藏)1998—2000年0.87⁃⁃⁃[18]格尔木与西宁(青海)1990—2000年5.84⁃⁃⁃[18]西藏Tibet2007年0.86⁃⁃⁃[11]玉龙雪山山麓(云南)1986—1993年1.78—2.04⁃⁃⁃[39]瓦里关本底台(青海)1997年2.92⁃⁃⁃[16]乌鲁木齐河谷(3551m)2003年4月—2004年2月1.53⁃1.59⁃[19]乌鲁木齐河谷(2119m)2003年4月—2004年2月1.94⁃⁃⁃[19]乌鲁木齐河源1号冰川2004年1月—2006年12月1.513.721.563.85本研究
(2) 乌鲁木齐河源1号冰川的硝铵比 (即![]() 月平均值都在0.3—1间波动,氮素来源受不同尺度气团输送的影响。
月平均值都在0.3—1间波动,氮素来源受不同尺度气团输送的影响。
(3) 乌鲁木齐河源1号冰川氮素湿沉降量的年际间变化幅度相对较小,采样点TIN湿沉降量年均值为1.51 kg/hm2。其中,![]() 占绝对优势,其沉降量占总量的69%,而
占绝对优势,其沉降量占总量的69%,而![]() 沉降量仅占31%。TON的干湿沉降总量年均值为2.29 kg/hm2,TN的干湿沉降总量年均值为3.85 kg/hm2。本研究估算的乌鲁木齐河源1号冰川氮素沉降量符合中国西部高寒区的一般水平,代表了该区域的本底值。
沉降量仅占31%。TON的干湿沉降总量年均值为2.29 kg/hm2,TN的干湿沉降总量年均值为3.85 kg/hm2。本研究估算的乌鲁木齐河源1号冰川氮素沉降量符合中国西部高寒区的一般水平,代表了该区域的本底值。
致谢:感谢中国科学院天山冰川站的所有野外观测人员对本工作的帮助。
References:
[1] Galloway J N, Townsend A R, Erisman J W, Bekunda M, Cai Z C, Freney J R, Martinelli L A, Seitzinger S P, Sutton M A. Transformation of the nitrogen cycle: recent trends, questions, and potential solutions. Science, 2008, 320(5878): 889- 892.
[2] Saros J E, Rose K C, Clow D W, Stephens V C, Nurse A B, Arnett H A, Stone J R, Williamson C E, Wolfe A P. Melting alpine glaciers enrich high-elevation lakes with reactive nitrogen. Environmental Science and Technology, 2010, 44(13): 4891- 4896.
[3] Bobbink R, Hicks K, Galloway J, Spranger T, Alkemade R, Ashmore M, Bustamante M, Cinderby S, Davidson E, Dentener F, Emmett B, Erisman J W, Fenn M, Gilliam F, Nordin A, Pardo L, de Vries W. Global assessment of nitrogen deposition effects on terrestrial plant diversity: a synthesis. Ecological Applications, 2010, 20(1): 30- 59.
[4] Lv C Q, Tian H Q, Huang Y. Ecological effects of increased nitrogen deposition in terrestrial ecosystems. Journal of Plant Ecology, 2007, 31(2): 205- 218.
[5] Xiao T, Qi Y Q, Wang J B. Nitrogen budget estimation based on precipitation and runoff in the source of Yangtze River. Acta Ecologica Sinica, 2010, 30(19): 5404- 5412.
[6] Xiong Z Q, Freney J R, Mosier A R, Zhu Z L, Lee Y, Yagi K. Impacts of population growth, changing food preferences and agricultural practices on the nitrogen cycle in East Asia. Nutrient Cycling in Agroecosystems, 2008, 80(2): 189- 198.
[7] Zhang Y, Liu X J, Zhang F S, Ju X T, Zou G Y, Hu K L. Spatial and temporal variation of atmospheric nitrogen deposition in North China Plain. Acta Ecologica Sinica, 2006, 26(6): 1633- 1639.
[8] Wang D X, Zhao P S, Zhang Y X, Zhang L H. Atmospheric nitrogen deposition in urban area of Beijing. Environmental Science, 2010, 31(9): 1987- 1992.
[9] Lamarque J F, Kiehl J T, Brasseur G P, Butler T, Cameron-Smith P, Collins W D, Collins W J, Granier C, Hauglustaine D, Hess P G, Holland E A, Horowitz L, Lawrence M G, McKenna D, Merilees P, Prather M J, Rasch P J, Rotman D, Shindell D, Thornton P. Assessing future nitrogen deposition and carbon cycle feedback using a multimodel approach: analysis of nitrogen deposition. Journal of Geophysical Research, 2005, 110, D19303, doi: 10.1029/2005JD005825.
[10] Liu X J, Duan L, Mo J M, Du E Z, Shen J L, Lu X K, Zhang Y, Zhou X B, He C E, Zhang F S. Nitrogen deposition and its ecological impact in China: an overview. Environmental Pollution, 2010, doi:10.1016/j.envpol.2010.08.002.
[11] Ti C P, Yan X Y. Estimation of atmospheric nitrogen wet deposition in China Mainland from based on N emission data. Journal of Agro-Environment Science, 2010, 29(8): 1606- 1611.
[12] Bowman W D. Inputs and storage of nitrogen in winter snowpack in an alpine ecosystem. Arctic and Alpine Research, 1992, 24(3): 211- 215.
[13] Hiltbrunner E, Schwikowski M, Korner C. Inorganic nitrogen storage in alpine snow pack in the Central Alps (Switzerland). Atmospheric Environment, 2005, 39(12): 2249- 2259.
[14] Baron J S, Rueth H M, Wolfe A P, Nydick K R, Allstott E J, Minear J T, Moraska B. Ecosystem responses to nitrogen deposition in the Colorado Front Range. Ecosystems, 2000, 3(4): 352- 368.
[15] Kang S C, Cong Z Y. Progress in study on precipitation and aerosol chemistry in the Tibetan Plateau. Journal of Glaciology and Geocryology, 2006, 28(3): 371- 379.
[16] Tang J, Xue H S, Yu X L, Cheng H B, Xu X B, Zhang X C, Ji J. The preliminary study on chemical characteristics of precipitation at Mt. Waliguan. Acta Scientiae Circumstantiae, 2000, 20(4): 420- 425.
[17] Zhang D, Shi C X, Jia L. Analysis on chemical composition of rainfall on the Tibet Plateau. Arid Zone Research, 2005, 22(4): 471- 475.
[18] Zhang D, Shi C X, Jia L. A study of chemical properties of rains on the Tibetan Plateau. Acta Scientiae Circumstantiae, 2004, 24(3): 555- 557.
[19] Zhao Z P, Tian L D, Fischer E, Li Z Q, Jiao K Q. Study of chemical composition of precipitation at an alpine site and a rural site in the Urumqi River Valley, Eastern Tien Shan, China. Atmospheric Environment, 2008, 42(39): 8934- 8942.
[20] Jia J Y, Zhang Y, Cai X B, Liu X J. A dynamic changes of wet deposition of nitrogen in southeast Tibet: taking Linzhi experiment station as an example. Acta Ecologica Sinica, 2009, 29(4): 1907- 1913.
[21] Jia J Y. Study of atmospheric wet deposition of nitrogen in Tibetan Plateau [D]. Nyingchi: Agriculture and Animal Husbandry College of Tibet University, 2008.
[22] Shao W, Zhang Y, Song L, Jia J Y, Liu X J, Cai X B. Atmospheric organic nitrogen deposition in Linzhi area, Tibet. Acta Ecologica Sinica, 2009, 29(10): 5586- 5591.
[23] Zhu G F, He Y Q, Pu T, Zhang N N. Characteristics of constant inorganic ions in precipitation at different altitudes precipitation in Yulong Snow Mountain Area. Environmental Science, 2011, 32(4): 963- 970.
[24] Zhao Z P, Li Z Q, Edwards R, Wang F T, Li H L, Zhu Y M. Atmosphere-to-snow-to-firn transfer of N![]() on Urumqi glacier No. 1, eastern Tien Shan, China. Annals of Glaciology, 2006, 43(1): 239- 244.
on Urumqi glacier No. 1, eastern Tien Shan, China. Annals of Glaciology, 2006, 43(1): 239- 244.
[25] Li H L, Li Z Q, Wang W B, Wang F T. Depositional characteristics of N![]() on Urumqi glacier No. 1, eastern Tien Shan, China. Annals of Glaciology, 2008, 49(1): 161- 165.
on Urumqi glacier No. 1, eastern Tien Shan, China. Annals of Glaciology, 2008, 49(1): 161- 165.
[26] Wang S J, Zhang M J, Wang F T, Li Z Q, Li Y J. Seasonal variations of nitrogen-containing ions concentration in surface snow at the headwaters of Urumqi River, Tianshan Mountains. Environmental Chemistry, 2011, 30(8): 1445- 1450.
[27] Wang S J, Zhang M J, Wang F T, Li Z Q. Influence of biomass burning in Central Asia on nitrate concentrations in Urumqi Glacier No.1, Eastern Tianshan Mountains, China. Environmental Science, 2011, 32(2): 338- 344.
[28] Wang S J, Zhang M J, Li Z Q, Wang F T, Zhang X Y, Li Y J. Evolution process of nitrate in snowpack of Glacier No. 1 at the headwaters of Urumqi River, Tianshan Mountains. Advances in Earth Science, 2011, 26(8): 897- 904.
[29] Michopoulos P, Baloutsos G, Economou A. Nitrogen cycling in a mature mountainous beech forest. Silva Fennica, 2008, 42(1): 5- 17.
[30] Wang X M, Yang L Y, Qin B Q, Ji L L, Jin H. Sources of inorganic nitrogen in wet deposition in Taihu Lake in spring. Acta Scientiarum Naturalium Universitatis Sunyatseni, 2006, 45(4): 93- 97.
[31] Wang Q, Wang X M, Lin W S, Zhong L J, Dong H Y, Liu H G. Study on sources of inorganic nitrogen in wet deposition in Dinghushan Mountain. Research of Environmental Sciences, 2008, 21(6): 156- 160.
[32] Zhao Z P, Li Z Q. Determination of soluble ions in atmospheric aerosol by ion chromatography. Modern Scientific Instruments, 2004, (5): 46- 49.
[33] Ding W C, Li X Q, Li Z Q, Wang F T. Chemical characteristics of the surface snow on Glacier No.1 at the Urumqi River Head: organic acids and inorganic anions. Journal of Glaciology and Geocryology, 2007, 29(5): 704- 709.
[34] Yang D Q, Jiang T, Zhang Y S, Kang E S. Analysis and correction of errors in precipitation measurement at the head of Urumqi River, Tianshan. Journal of Glaciology and Geocryology, 1988, 10(4): 384- 399.
[35] Li Z Q, Wang W B, Wang F T, Li H L, Zhang M J. Characteristics of ionic concentration and δ18O and their variability in dry-season and wet-season snow on Urumqi glacier No. 1, eastern Tien Shan, central Asia. Annals of Glaciology, 2008, 49(1): 217- 223.
[36] Xie Y X, Zhang S L, Zhao X, Xiong Z Q, Xing G X. Seasonal variation patterns of N![]() -N/
-N/![]() ratio and δ15N
ratio and δ15N![]() value in rainwater in Yangtze River Delta. Chinese Journal of Applied Ecology, 2008, 19(9): 2035- 2041.
value in rainwater in Yangtze River Delta. Chinese Journal of Applied Ecology, 2008, 19(9): 2035- 2041.
[37] Sun Q R, Wang M R. Ammonia emission and concentration in the atmosphere over China. Scientia Atmospherica Sinica, 1997, 21(5): 590- 598.
[38] Dentener F, Drevet J, Lamarque J F, Bey I, Eickhout B, Fiore A M, Hauglustaine D, Horowitz L W, Krol M, Kulshrestha U C, Lawrence M, Galy-Lacaux C, Rast S, Shindell D, Stevenson D, Van Noije T, Atherton C, Bell N, Bergman D, Butler T, Cofala J, Collins B, Doherty R, Ellingsen K, Galloway J, Gauss M, Montanaro V, Muller J F, Pitari G, Rodriguez J, Sanderson M, Solmon F, Strahan S, Schultz M, Sudo K, Szopa S, Wild O. Nitrogen and sulfur deposition on regional and global scales: a multimodel evaluation. Global Biogeochemical Cycles, 2006, 20, GB4003, doi: 10.1029/2005GB002672.
[39] Liu J Q. Research on precipitation background value and definition of acid rain. Environmental Monitoring in China, 1996, 12(5): 5- 9.
参考文献:
[4] 吕超群, 田汉勤, 黄耀. 陆地生态系统氮沉降增加的生态效应. 植物生态学报, 2007, 31(2): 205- 218.
[5] 肖桐, 齐永青, 王军邦. 基于降水和径流的长江源头氮素收支研究. 生态学报, 2010, 30(19): 5404- 5412.
[7] 张颖, 刘学军, 张福锁, 巨晓棠, 邹国元, 胡克林. 华北平原大气氮素沉降的时空变异. 生态学报, 2006, 26(6): 1633- 1639.
[8] 王德宣, 赵普生, 张玉霞, 张丽华. 北京市区大气氮沉降研究. 环境科学, 2010, 31(9): 1987- 1992.
[11] 遆超普, 颜晓元. 基于氮排放数据的中国大陆大气氮素湿沉降量估算. 农业环境科学学报, 2010, 29(8): 1606- 1611.
[15] 康世昌, 丛志远. 青藏高原大气降水和气溶胶化学特征研究进展. 冰川冻土, 2006, 28(3): 371- 379.
[16] 汤洁, 薛虎圣, 于晓岚, 程红兵, 徐晓斌, 张晓春, 季军. 瓦里关山降水化学特征的初步分析. 环境科学学报, 2000, 20(4): 420- 425.
[17] 章典, 师长兴, 假拉. 西藏降水化学分析. 干旱区研究, 2005, 22(4): 471- 475.
[18] 章典, 师长兴, 假拉. 青藏高原降水化学研究. 环境科学学报, 2004, 24(3): 555- 557.
[20] 贾钧彦, 张颖, 蔡晓布, 刘学军. 藏东南大气氮湿沉降动态变化——以林芝观测点为例. 生态学报, 2009, 29(4): 1907- 1913.
[21] 贾钧彦. 西藏高原大气氮湿沉降研究[D]. 林芝: 西藏大学农牧学院, 2008.
[22] 邵伟, 张颖, 宋玲, 贾钧彦, 刘学军, 蔡晓布. 西藏林芝大气有机氮沉降. 生态学报, 2009, 29(10): 5586- 5591.
[23] 朱国锋, 何元庆, 蒲焘, 张宁宁. 玉龙雪山地区不同海拔高度降水中常量无机离子特征分析. 环境科学, 2011, 32(4): 963- 970.
[26] 王圣杰, 张明军, 王飞腾, 李忠勤, 李亚举. 天山乌鲁木齐河源区表层雪中含氮离子季节变化特征. 环境化学, 2011, 30(8): 1445- 1450.
[27] 王圣杰, 张明军, 王飞腾, 李忠勤. 天山东部雪冰中硝酸根浓度对中亚生物质燃烧的响应研究. 环境科学, 2011, 32(2): 338- 344.
[28] 王圣杰, 张明军, 李忠勤, 王飞腾, 张晓宇, 李亚举. 天山乌鲁木齐河源1号冰川雪层中![]() 的演化过程. 地球科学进展, 2011, 26(8): 897- 904.
的演化过程. 地球科学进展, 2011, 26(8): 897- 904.
[30] 王雪梅, 杨龙元, 秦伯强, 纪玲玲, 金辉. 春季太湖水域无机氮湿沉降来源初探. 中山大学学报: 自然科学版, 2006, 45(4): 93- 97.
[31] 王茜, 王雪梅, 林文实, 钟流举, 董汉英, 刘海岗. 鼎湖山无机氮湿沉降来源研究. 环境科学研究, 2008, 21(6): 156- 160.
[32] 赵中平, 李忠勤. 离子色谱法测定大气气溶胶中的可溶性离子. 现代科学仪器, 2004, (5): 46- 49.
[33] 丁文慈, 李心清, 李忠勤, 王飞腾. 乌鲁木齐河源1号冰川表层雪的化学特征——以低分子有机酸和无机阴离子为例. 冰川冻土, 2007, 29(5): 704- 709.
[34] 杨大庆, 姜彤, 张寅生, 康尔泗. 天山乌鲁木齐河源降水观测误差分析及其改正. 冰川冻土, 1988, 10(4): 384- 399.
[36] 谢迎新, 张淑利, 赵旭, 熊正琴, 邢光熹. 长江三角洲地区雨水中![]() 和
和![]() 值的变化. 应用生态学报, 2008, 19(9): 2035- 2041.
值的变化. 应用生态学报, 2008, 19(9): 2035- 2041.
[37] 孙庆瑞, 王美蓉. 我国氨的排放量和时空分布. 大气科学, 1997, 21(5): 590- 598.
[39] 刘嘉麒. 降水背景值与酸雨定义研究. 中国环境监测, 1996, 12(5): 5- 9.
Atmospheric nitrogen deposition in the glacier regions of Northwest China: a case study of Glacier No.1 at the headwaters of Urumqi River, Tianshan Mountains
Abstract: The atmospheric nitrogen deposition in the cold region (especially in the glacier region) of Northwest China, which takes a vital role during the nitrogen cycle, may influence the regional ecology and environment. And the long-term systemic observation on nitrogen deposition in the glacier region is helpful for quantitative modelling of typical drainage basins in the High Asia. According to the continues sampling of wet deposition (fresh snow) on the eastern branch of Glacier No.1 (43°06′N, 86°49′E, 4130 m above sea level) at the headwaters of Urumqi River in the eastern Tianshan Mountains from January 2004 to December 2006, the characteristics of atmospheric nitrogen wet deposition in the glacier region of Northwest China were discussed, and the annual nitrogen wet/dry deposition of both inorganic and organic types was estimated. The results indicated: (1) The nitrate nitrogen (![]() ), ammonium nitrogen (N
), ammonium nitrogen (N![]() -N) and total inorganic nitrogen (TIN) in the wet deposition varied seasonally. The nitrogen wet deposition from January to April was relatively low, and it increased significantly from April to May. With a little fluctuation, the nitrogen wet deposition was high from May to September, and the minimum of monthly deposition was 0.17 kg/hm2, 0.04 kg/hm2, 0.13 kg/hm2, for TIN,
-N) and total inorganic nitrogen (TIN) in the wet deposition varied seasonally. The nitrogen wet deposition from January to April was relatively low, and it increased significantly from April to May. With a little fluctuation, the nitrogen wet deposition was high from May to September, and the minimum of monthly deposition was 0.17 kg/hm2, 0.04 kg/hm2, 0.13 kg/hm2, for TIN, ![]() and N
and N![]() -N, respectively. The nitrogen wet deposition decreased markedly after October, and kept at a low level from October to December. In the seasonal classification, the nitrogen wet deposition was highest in summer (June, July and August), and lowest in winter (November, December and January). The percentage of nitrogen wet deposition in summer was 54%, 52% and 55%, for TIN,
-N, respectively. The nitrogen wet deposition decreased markedly after October, and kept at a low level from October to December. In the seasonal classification, the nitrogen wet deposition was highest in summer (June, July and August), and lowest in winter (November, December and January). The percentage of nitrogen wet deposition in summer was 54%, 52% and 55%, for TIN, ![]() and N
and N![]() -N, respectively. The nitrogen wet deposition correlated with precipitation amount significantly, and more than 93% of which occurred during the wet season (from April to October, with abundant precipitation in this period). (2) The
-N, respectively. The nitrogen wet deposition correlated with precipitation amount significantly, and more than 93% of which occurred during the wet season (from April to October, with abundant precipitation in this period). (2) The ![]() / N
/ N![]() -N ratio of wet deposition ranged from 0.3 to 1, which was influenced by both the regional emission and atmospheric transportation. The spatial transportation was calculated by the HYSPLIT (Hybrid Single-Particle Lagrangian Integrated Trajectory, which was developed by the Air Resources Laboratory, National Oceanic and Atmospheric Administration of USA) model 4.9 at 8:00 and 20:00 in Beijing Time (0:00 and 12:00 in Coordinated Universal Time) during all the precipitation days from 2004 to 2006 in different starting heights. (3) The inter-annual variation was not obvious during the study period of three years, so the mean annual deposition was representative at the sampling site. The mean annual wet deposition of TIN was 1.51 kg/hm2 with 69% of N
-N ratio of wet deposition ranged from 0.3 to 1, which was influenced by both the regional emission and atmospheric transportation. The spatial transportation was calculated by the HYSPLIT (Hybrid Single-Particle Lagrangian Integrated Trajectory, which was developed by the Air Resources Laboratory, National Oceanic and Atmospheric Administration of USA) model 4.9 at 8:00 and 20:00 in Beijing Time (0:00 and 12:00 in Coordinated Universal Time) during all the precipitation days from 2004 to 2006 in different starting heights. (3) The inter-annual variation was not obvious during the study period of three years, so the mean annual deposition was representative at the sampling site. The mean annual wet deposition of TIN was 1.51 kg/hm2 with 69% of N![]() -N and 31% of
-N and 31% of ![]() . Considering the dry/wet deposition in total, the mean annual deposition of TIN was 1.56 kg/hm2, with 1.07 kg/hm2 of N
. Considering the dry/wet deposition in total, the mean annual deposition of TIN was 1.56 kg/hm2, with 1.07 kg/hm2 of N![]() -N and 0.49 kg/hm2 of
-N and 0.49 kg/hm2 of ![]() . In addition, the estimated annual dry/wet deposition of total nitrogen (TN), including TIN and TON (total organic nitrogen), was 3.85 kg/hm2. The simulant value in this study corresponded well with the reported data of nitrogen deposition around the cold region in the West China.
. In addition, the estimated annual dry/wet deposition of total nitrogen (TN), including TIN and TON (total organic nitrogen), was 3.85 kg/hm2. The simulant value in this study corresponded well with the reported data of nitrogen deposition around the cold region in the West China.
Key Words: glacier regions; glacier No.1 at the headwaters of Urumqi River; nitrogen deposition; inorganic nitrogen; wet deposition
基金项目:国家自然科学基金项目(41161012,40701035);教育部新世纪优秀人才支持计划项目(NCET- 10- 0019);国家重点基础研究发展计划(973)项目(2010CB951003);中国科学院知识创新工程重要方向项目(KZCX2-EW- 311)
收稿日期:2011- 06- 29;
修订日期:2011- 11- 14
*通讯作者Corresponding author.E-mail: mjzhang2004@163.com
DOI: 10.5846/stxb201106290975
王圣杰, 张明军, 王飞腾, 李忠勤.中国西北典型冰川区大气氮素沉降量的估算——以天山乌鲁木齐河源1号冰川为例.生态学报,2012,32(3):777- 785.
Wang S J, Zhang M J, Wang F T, Li Z Q.Atmospheric nitrogen deposition in the glacier regions of Northwest China: a case study of Glacier No.1 at the headwaters of Urumqi River, Tianshan Mountains.Acta Ecologica Sinica,2012,32(3):777- 785.