祁连山东段宁缠河1号冰川和水管河4号冰川表面运动速度研究
【类型】期刊
【作者】曹泊,王杰,潘保田,张兴余,崔航(兰州大学西部环境教育部重点实验室/干旱环境与气候变化协同创新中心;中国人民解放军61243部队)
【作者单位】兰州大学西部环境教育部重点实验室/干旱环境与气候变化协同创新中心;中国人民解放军61243部队
【刊名】冰川冻土
【关键词】 冷龙岭;宁缠河1号冰川;水管河4号冰川;冰川表面运动速度
【资助项】科技部基础性工作专项基金项目;国家自然科学基金重大研究计划项目;教育部博士研究生学术新人奖 中央高校基本科研业务费专项资金项目(LZUJBKY-2013-125)资助
【ISSN号】1000-0240
【页码】P1428-1435
【年份】2019
【期号】第6期
【期刊卷】1;|7;|8;|2
【摘要】祁连山东段冷龙岭北坡冰川融水是河西走廊重要的水源补给,然而却少有现代冰川运动观测资料.通过在该区域宁缠河1号和水管河4号冰川布设花杆,观测了冰川表面的运动速度.结果表明:2010-2012年,面积较大的水管河4号冰川表面年平均运动速度(5.2m·a-1)要高于面积相对较小的宁缠河1号冰川(2.8m·a-1).水管河4号冰川最大运动速度出现在花杆观测区域的最上部(接近物质平衡线),宁缠河1号冰川最大运动速度出现在坡度较大的区域,说明冰川最大运动速度通常出现在平衡线附近,但还要考虑坡度等地形因素的影响.较之早期的观测资料,水管河4号和其他中国西部地区冰川的运动速度呈现出减缓趋势,可能是物质平衡持续亏损导致冰川厚度变薄的直接结果.
【全文】 文献传递
祁连山东段宁缠河1号冰川和水管河4号冰川表面运动速度研究
摘 要:祁连山东段冷龙岭北坡冰川融水是河西走廊重要的水源补给,然而却少有现代冰川运动观测资料.通过在该区域宁缠河1号和水管河4号冰川布设花杆,观测了冰川表面的运动速度.结果表明:2010-2012年,面积较大的水管河4号冰川表面年平均运动速度(5.2m·a-1)要高于面积相对较小的宁缠河1号冰川(2.8m·a-1).水管河4号冰川最大运动速度出现在花杆观测区域的最上部(接近物质平衡线),宁缠河1号冰川最大运动速度出现在坡度较大的区域,说明冰川最大运动速度通常出现在平衡线附近,但还要考虑坡度等地形因素的影响.较之早期的观测资料,水管河4号和其他中国西部地区冰川的运动速度呈现出减缓趋势,可能是物质平衡持续亏损导致冰川厚度变薄的直接结果.
关键词:冷龙岭;宁缠河1号冰川;水管河4号冰川;冰川表面运动速度
0 引言
冰川对气候变化的响应非常明显[1],其中山地冰川尤为显著[2].随着全球气候的变化,全球冰川急剧退缩,大部分的山地冰川呈现着不同规模的退缩已成为不争的事实;同时,也有研究发现少数冰川却呈现出前进和跃动等特殊行为[3-5],这在很大程度上与冰川的运动特征有关[6].冰川对气候变化响应的研究中,多关注于冰川面积、厚度、储量和物质平衡等方面,而有关冰川运动速度的研究却相对较少.冰川由于受到重力作用的驱动发生着沿坡向下的位移;此外冰川还可能发生底部运动包括在下伏基岩上发生的滑动与底部沉积层变形造成的运动.这两种运动过程构成了冰川运动的主要形式[7-8].运动是冰川的基本过程,是冰川动力学的基础,是冰川区别于其他自然冰体的主要标志之一[9],是冰川存在和发育的主要机制.冰川运动速度不仅是冰川动力学模型和分布式冰川水文模型必不可少的参数之一,也是进行冰川阻塞湖溃决等相关灾害模型和预测的重要参数[10-11].
目前,冰川表面运动速度的研究最直接最常用的也是精度最高的方法是在冰川上布设测杆,并进行长期连续观测[12-14].随着科学技术的不断发展,一些新方法如雷达[15-17]、光学影像[18-20]等被广泛地应用于冰川运动速度的研究.中国是世界上山岳冰川最发育的国家之一,自20世纪50年代以来,学者们采用不同的观测方法相继在西部的多个山地开展了相关的研究,如天山乌鲁木齐河源1号冰川[21]和哈希勒根51号冰川[22];喜马拉雅山的枪勇冰川和绒布冰川[22];念青唐古拉山的帕隆4号和94号冰川[22];唐古拉山的冬克玛底冰川[23]以及高原内部的普若岗日冰原[24]等.然而有长序列运动速度监测资料的冰川较少.20世纪60、70年代对祁连山的老虎沟12号冰川、七一冰川、羊龙河5号冰川、水管河4号冰川进行了运动速度的观测研究[25],后来由于种种原因,对冰川运动速度的观测中断了,直到2005年起才对祁连山西段老虎沟12号冰川、中段七一冰川恢复运动观测[26-27].而祁连山东段冰川的运动速度近几十年的变化却不甚了解,严重阻碍了利用动力学模式模拟评估该区域未来冰川水资源工作的开展.
所以,本文选择祁连山东段冷龙岭北坡的宁缠河1号(NC 1号)冰川和水管河4号(SG 4号)冰川作为研究对象,通过在冰川表面布设花杆观测方法,观测冰川的运动速度并与历史观测资料进行对比,分析近年来冰川运动速度的变化.
1 研究区概况
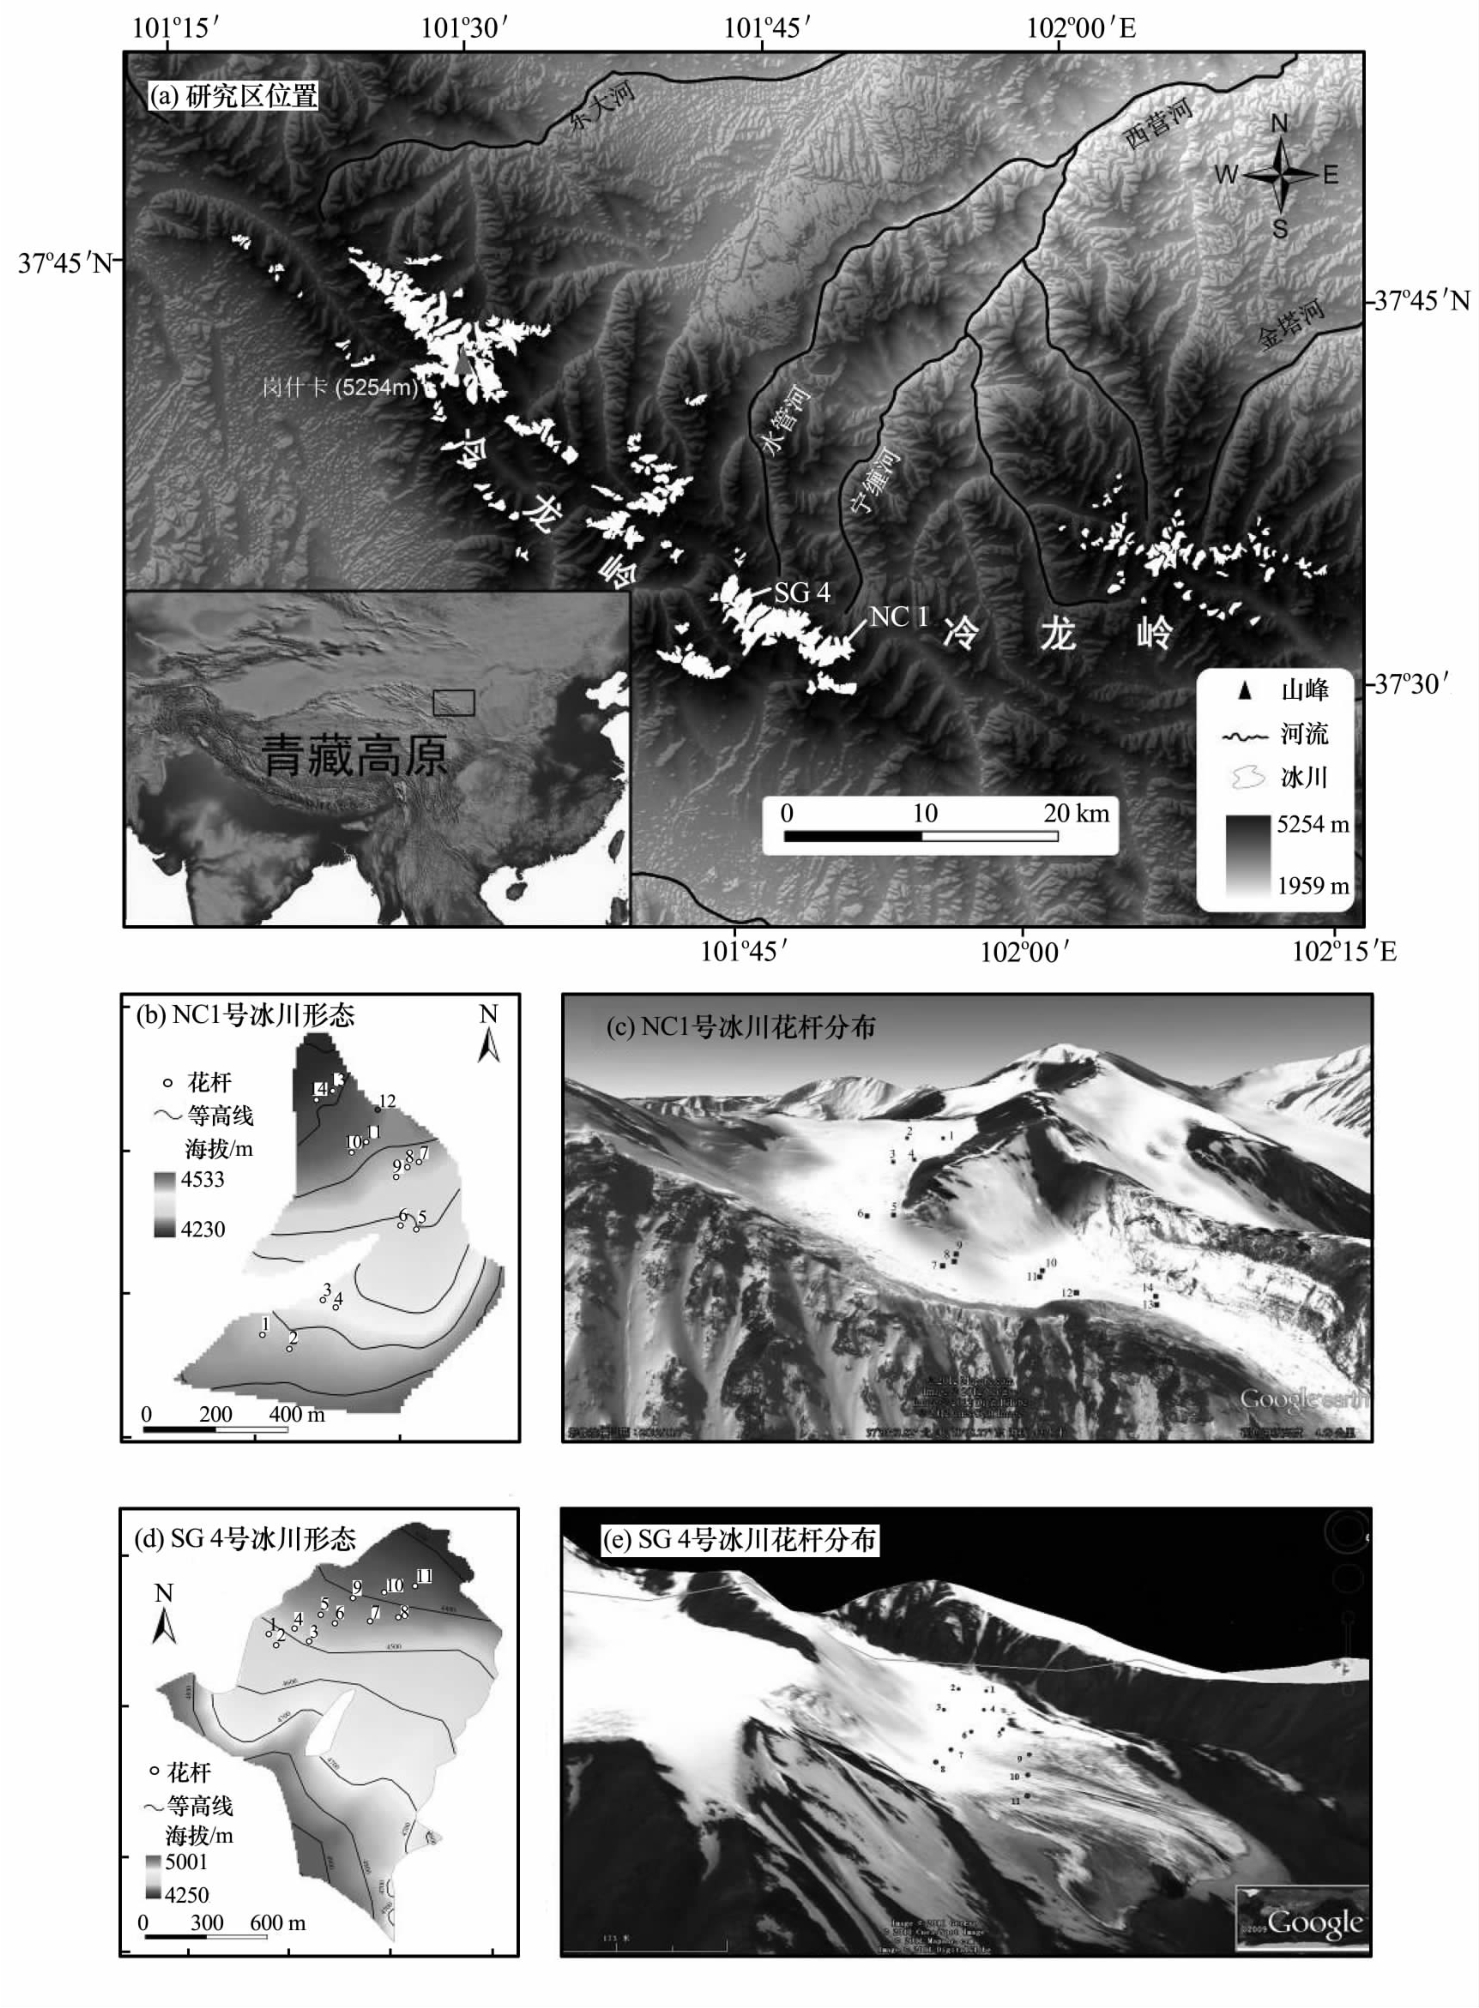
图1 研究区位置(a),NC 1号冰川形态(b)及其花杆分布(c)与SG 4号冰川形态(d)及其花杆分布(e)
Fig.1 The location of the study areas(a),overview of the NC No.1Glacier(b)and allocation of stakes in Google Earth(c),and overview of SG No.4Glacier(d)and allocation of stakes in Google Earth(e)
据第一次冰川编目[28],1972年祁连山东段冷龙岭地区的现代冰川总面积达103.02km2,冰川平均面积0.42km2,都为亚大陆型小冰川.冰川区年降水量约为700~800mm[29],物质平衡线处温度大约-10℃[30].NC 1号冰川和SG 4号冰川都处于冷龙岭的北坡(图1a),冰川融水注入甘肃三大内陆河之一的石羊河流域.NC 1号冰川(冰川编号:5Y416F0001),面积0.74km2,长1.1km;冰川末端海拔4170m,最高海拔4622m(图1b),表面较为平坦,几乎无表碛覆盖,冰裂隙极少发育(图1c).SG 4号冰川(冰川编号:5Y416G0004),面积1.86km2,长2.0km,冰川末端海拔4200m,最高海拔5024m(图1d),冰川表面也几乎无表碛覆盖(图1e),但积累区裂隙较为发育.
2 运动速度的观测
于2010年9月9日(消融季末)在NC 1号和SG 4号冰川表面分别布设了14根和11根花杆.由于NC 1号冰川冰面平坦,冰裂隙很少发育,花杆可以从冰川末端一直布设至冰川后壁(图1c);而SG 4号冰川积累区冰裂隙较多,所以花杆只布设在其消融区(图1e).用Trimble 5800GPS测量不同时间段花杆的位移量,其位移量与时间的比值即为该时段的运动速度.测量中采用静态相对定位观测法,每一条基线的观测时间为20min.依据该型号GPS的技术手册,该观测时间足以使仪器水平和垂直测量精度要高于0.05m和0.2m;即使在冰川表面测量时,有云和电离层等外在因素干扰使其分辨率有所降低,GPS的水平和垂直测量精度也会控制在0.1m 和0.3m 之内[31].
3 结果分析与讨论
NC 1号和SG 4号冰川基本都沿着冰川中流线向末端方向流动(图2a,b),且基本符合一般山谷冰川运动速度的分布规律,即冰川最大运动速度通常出现在平衡线附近,从平衡线往下向着冰舌末端运动速度不断减缓[22,28].
由于这两条冰川同属于亚大陆型的小冰川,其表面运动速度都不大(表1和2).NC 1号冰川的表面平均运动速度约为2.8m·a-1,冰川末端和后壁运动速度相对较小,大约为1~2m·a,而最大运动速度出现海拔4300~4400m的冰川中部区域,大约3~4m·a-1.根据近期野外观测显示[32],该区域冰川物质平衡线的海拔约为4500~4600m,运动速度的最大值并未出现在更接近雪线的区域,可能是由坡度的差异引起.通常而言冰川运动速度会随坡度的增加而增大[22],而该条冰川中部的平均坡度是整个冰川区最大的(图1c).SG 4号冰川表面的年平均运动速度约为5.2m·a-1,其最大运动速度出现在更为接近物质平衡线高度处观测区的上部(海拔4400~4500m左右),约为7m·a-1,而冰川末端运动速度相对较小,仅有3~4m·a-1(表2).
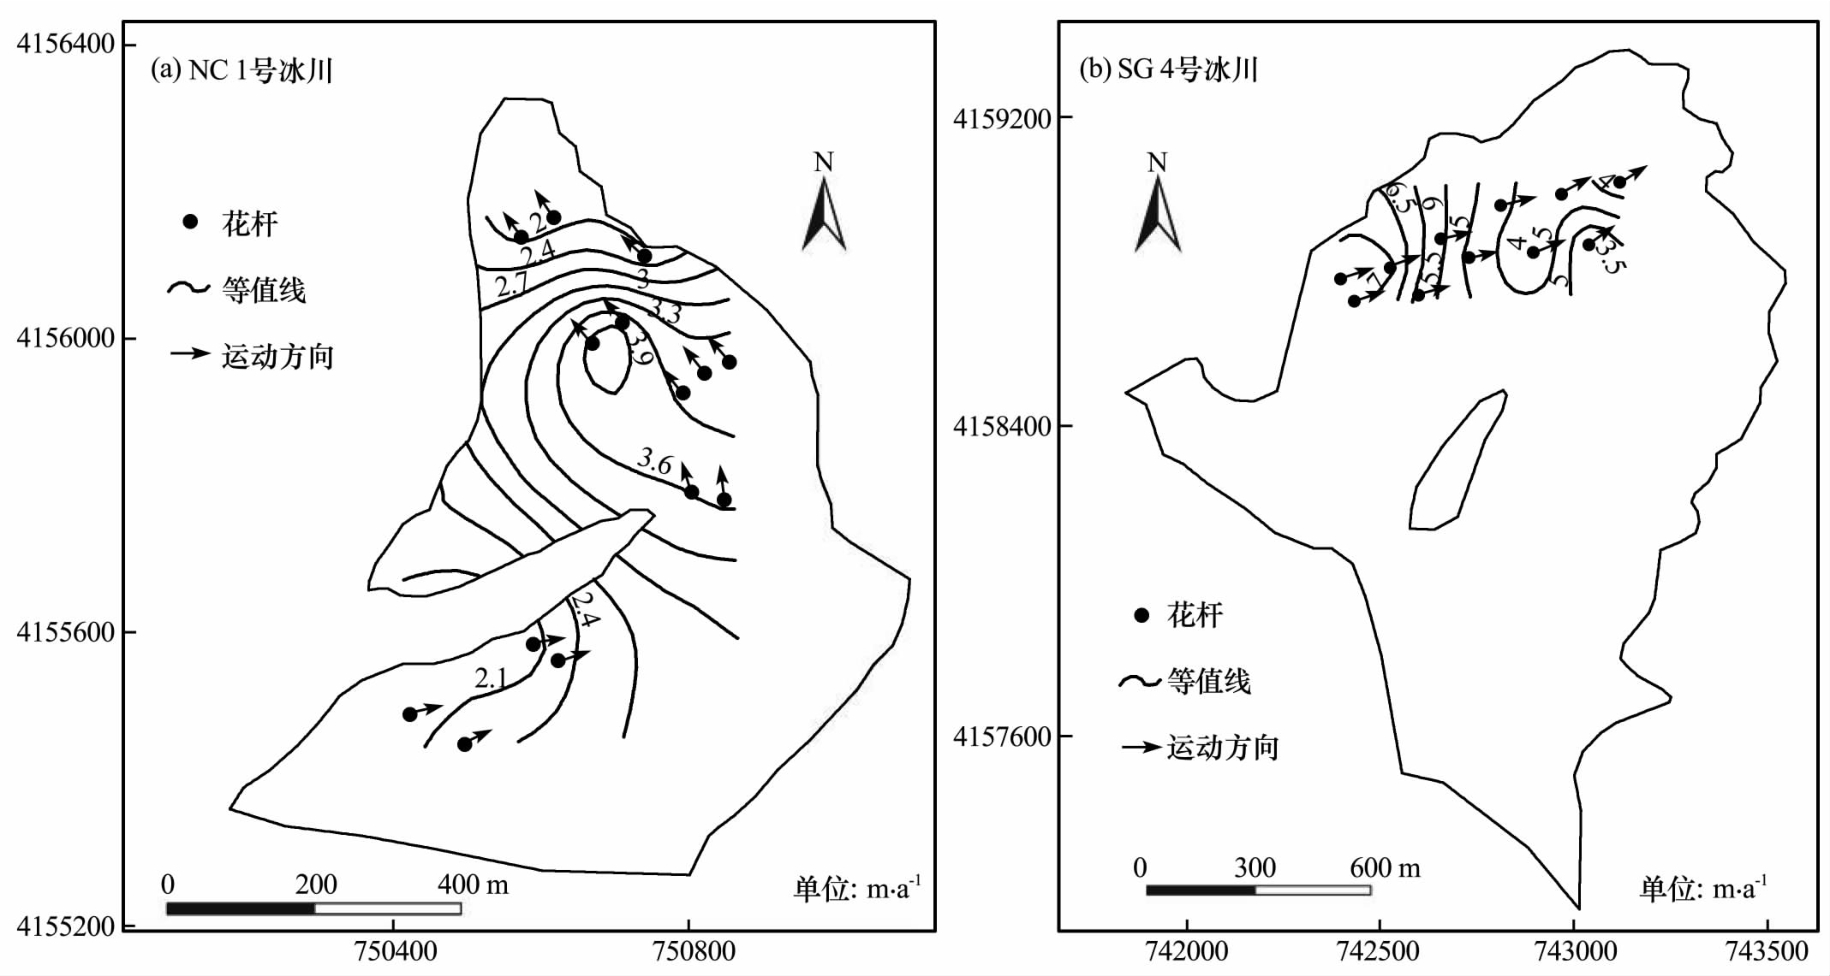
图2 2010-2012年NC 1号冰川(a)和SG 4号冰川(b)表面运动方向与平均运动速度
Fig.2 Surface flow velocities and directions on NC No.1(a)and SG No.4(b)Glaciers from 2010to 2012
表1 NC 1号冰川表面运动速度
Table 1 Surface flow velocities of NC No.1Glacier
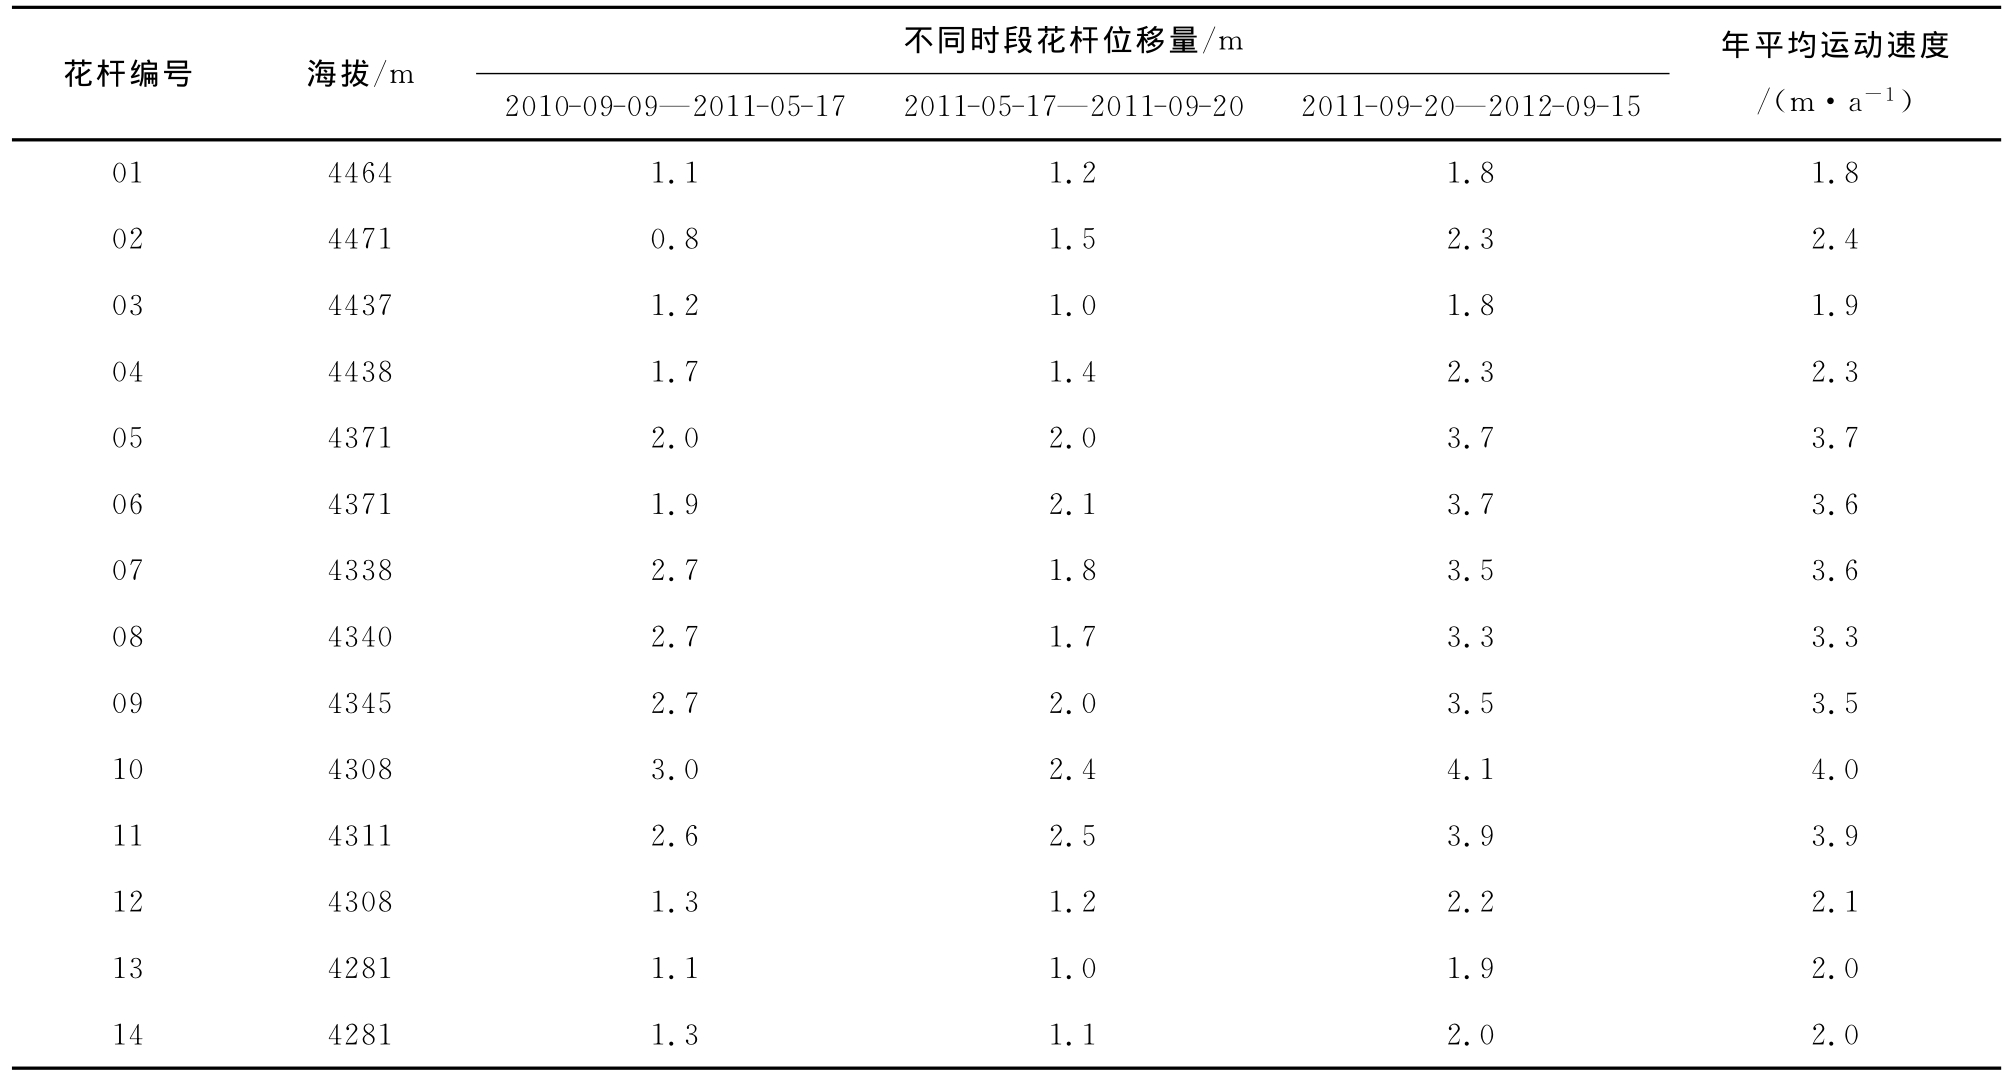
花杆编号 海拔/m不同时段花杆位移量/m 2010-09-09—2011-05-172011-05-17—2011-09-202011-09-20—2012-09-15年平均运动速度/(m·a-1)01 4464 1.1 1.2 1.8 1.802 4471 0.8 1.5 2.3 2.403 4437 1.2 1.0 1.8 1.904 4438 1.7 1.4 2.3 2.305 4371 2.0 2.0 3.7 3.706 4371 1.9 2.1 3.7 3.607 4338 2.7 1.8 3.5 3.608 4340 2.7 1.7 3.3 3.309 4345 2.7 2.0 3.5 3.510 4308 3.0 2.4 4.1 4.011 4311 2.6 2.5 3.9 3.912 4308 1.3 1.2 2.2 2.113 4281 1.1 1.0 1.9 2.014 4281 1.3 1.1 2.0 2.0
表2 SG 4号冰川表面运动速度
Table 2 Surface flow velocities of SG No.4Glacier
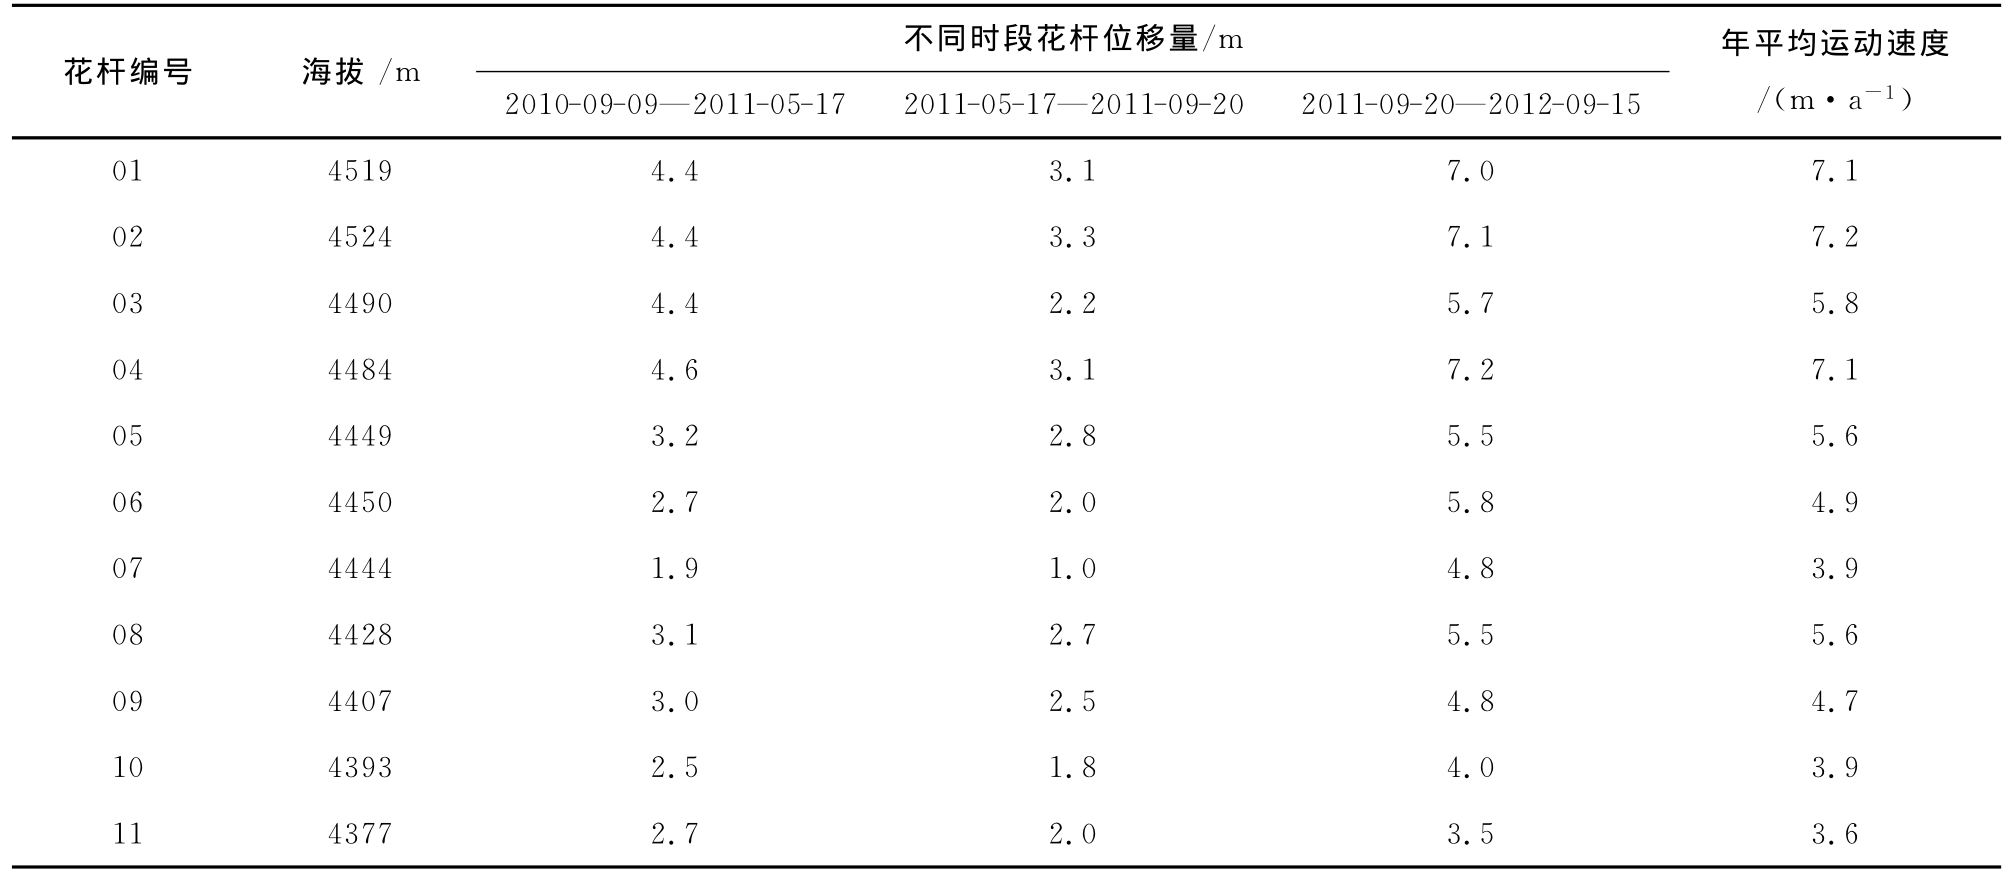
花杆编号 海拔/m不同时段花杆位移量/m 2010-09-09—2011-05-172011-05-17—2011-09-202011-09-20—2012-09-15年平均运动速度/(m·a-1)01 4519 4.4 3.1 7.0 7.102 4524 4.4 3.3 7.1 7.203 4490 4.4 2.2 5.7 5.804 4484 4.6 3.1 7.2 7.105 4449 3.2 2.8 5.5 5.606 4450 2.7 2.0 5.8 4.907 4444 1.9 1.0 4.8 3.908 4428 3.1 2.7 5.5 5.609 4407 3.0 2.5 4.8 4.710 4393 2.5 1.8 4.0 3.911 4377 2.7 2.0 3.5 3.6
对我国不同区域山谷冰川的运动速度观测研究发现[33],同等规模下海洋型冰川要比大陆型冰川运动速度大;如面积较大的横断山区海螺沟冰川比大陆型冰川的老虎沟12号冰川运动速度大.同一冰川类型下,规模大的冰川运动速度值大,规模小的冰川运动速度值小,如处于同一个地方受到同样的气候变化控制的NC 1号和SG 4号冰川,面积大的SG 4号冰川的运动速度比前者的大;同为祁连山北坡的SG 4号冰川、七一冰川、老虎沟12号冰川,随着冰川面积的增大,冰川运动速度也随之加快(表3).
据孙作哲等[25]的观测,1963年SG 4号冰川冰舌区年平均运动速度大约为12.2m·a-1,1976年冰舌区的年平均运动速度仅为6.6m·a-1;而2010-2012年SG 4号冰川的运动速度又有所减缓(5.2m·a-1).对比中国西部山区冰川的运动速度变化,发现近几十年都有逐渐减小的趋势.井哲帆等[34]通过在天山奎屯河哈希勒根51号冰川的研究,发现冰舌表面运动从1999-2007年有不断减小的趋势;乌鲁木齐河源1号冰川的运动速度,从1962年之后不断衰减,到2000年左右,冰川的平均运动速度降低为5m·a-1左右[36],并且这个趋势还会持续下去,在今后的一段时间里,其平均运动速度不会超过5m·a-1[21].此外,喜马拉雅山的枪勇冰川[22]、横断山区的海螺沟冰川[37]和祁连山的多条冰川(表3)也都表现出了运动速度的逐渐减缓.近几十年来,中国西部气温普遍呈升高趋势[29],冰川不断地以面积减小、厚度变薄、物质平衡线高度上升、积累区面积比率(AAR)值减小和物质平衡的持续亏损对此进行着响应[21,38-39],这种响应的最终结果就是冰川能量的减小和运动速度的减缓[40].
表3 祁连山区典型冰川表面运动速度
Table 3 Surface flow velocities of some glaciers in the Qilian Mountains
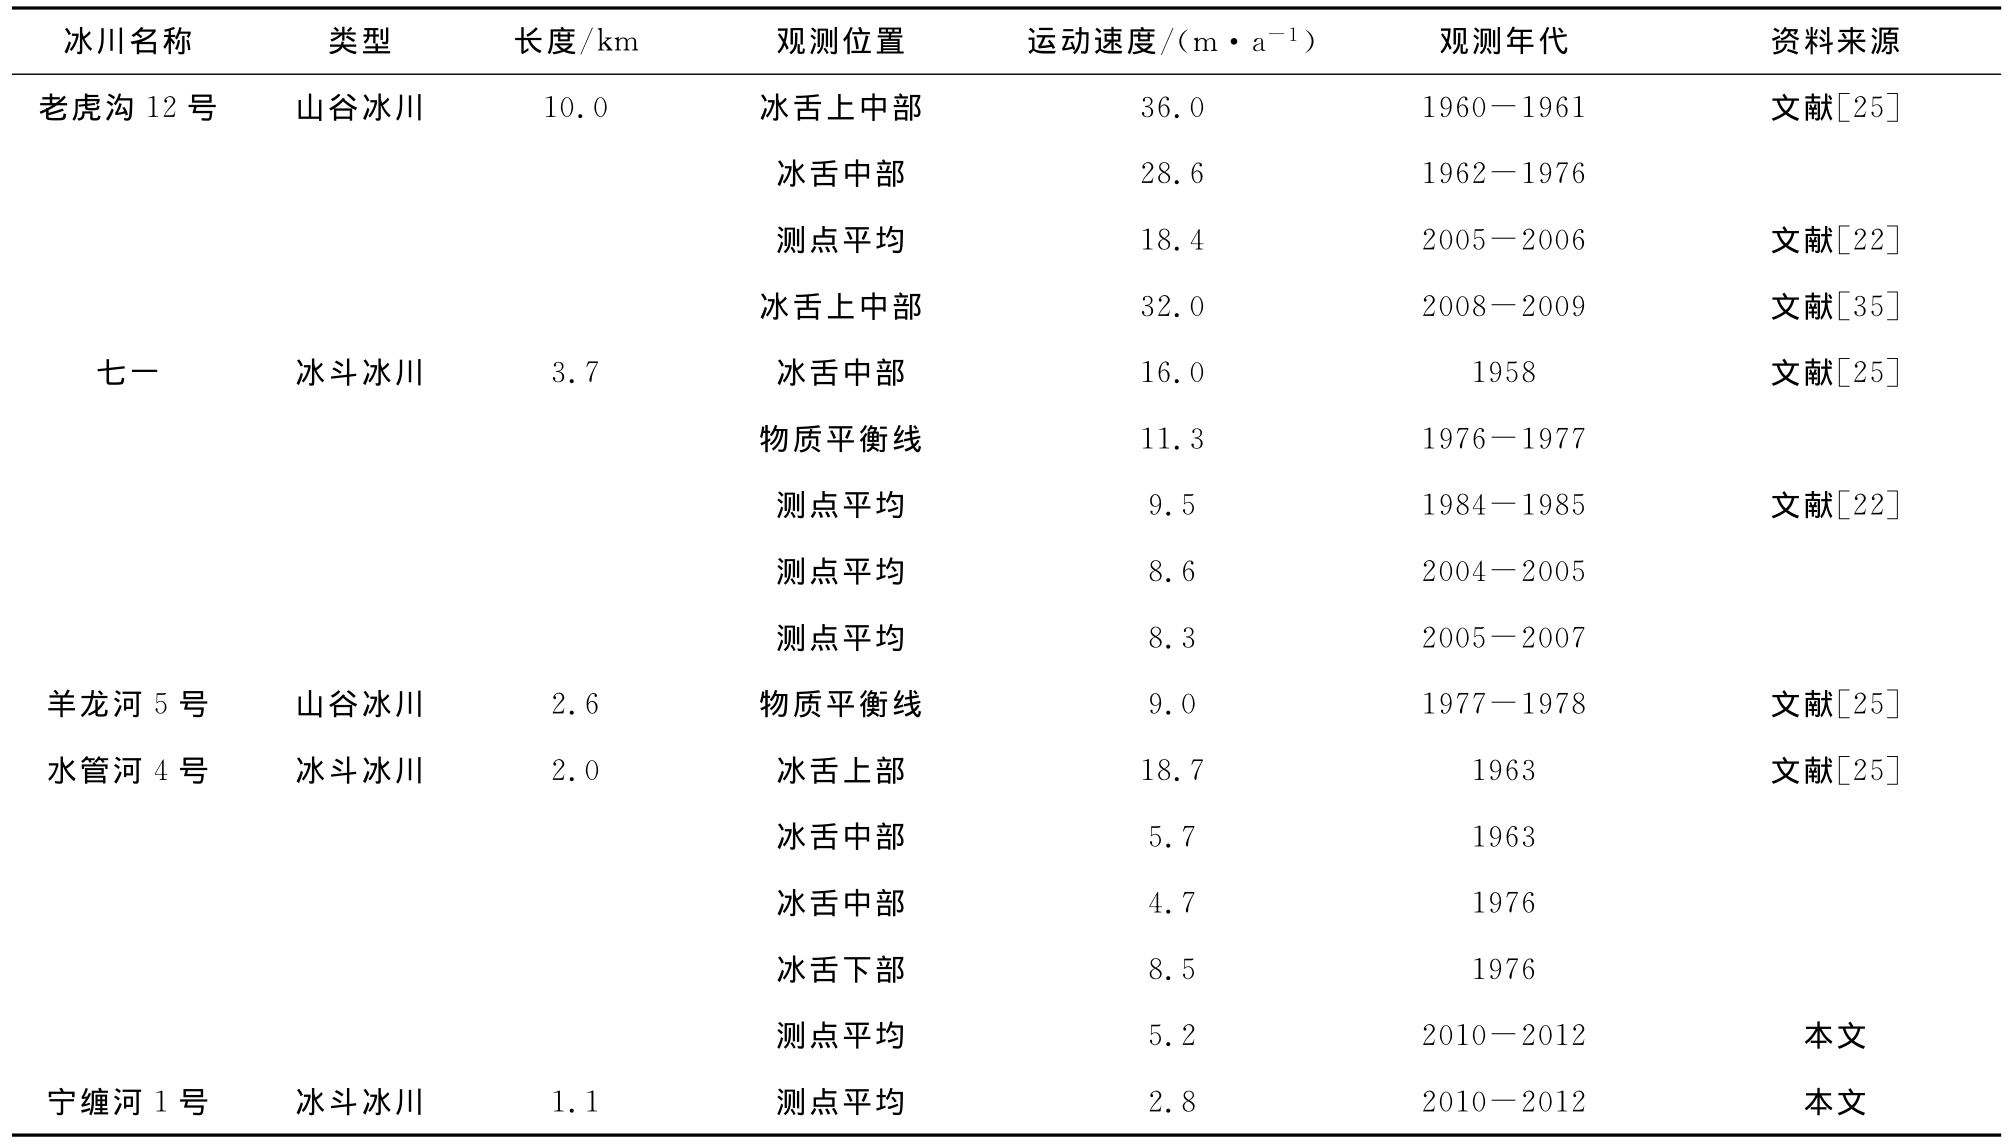
冰川名称 类型 长度/km 观测位置 运动速度/(m·a-1) 观测年代 资料来源老虎沟12号 山谷冰川 10.0 冰舌上中部 36.0 1960-1961 文献[25]冰舌中部 28.6 1962-1976测点平均 18.4 2005-2006 文献[22]冰舌上中部 32.0 2008-2009 文献[35]七一 冰斗冰川 3.7 冰舌中部 16.0 1958 文献[25]物质平衡线 11.3 1976-1977测点平均 9.5 1984-1985 文献[22]测点平均 8.6 2004-2005测点平均 8.3 2005-2007羊龙河5号 山谷冰川 2.6 物质平衡线 9.0 1977-1978 文献[25]水管河4号 冰斗冰川 2.0 冰舌上部 18.7 1963 文献[25]冰舌中部 5.7 1963冰舌中部 4.7 1976冰舌下部 8.5 1976测点平均 5.2 2010-2012 本文宁缠河1号 冰斗冰川 1.1 测点平均 2.8 2010-2012本文
4 结论
基于2010-2012年祁连山东段冷龙岭北坡两条冰川表面运动速度的观测,发现NC 1号冰川和SG 4号冰川的年平均运动速度分别为2.8m·a-1和5.2m·a-1.SG 4号冰川表面年平均最大运动速度出现在更为接近物质平衡线的观测区上部;NC 1号冰川表面年平均最大运动速度出现在坡度较大的区域.这些结果表明,冰川表面运动速度通常要遵循冰川的流动特性,即最大运动速度一般出现在平衡线附近,但还要考虑坡度等地形因素的影响.而近几十年,中国西部普遍出现的冰川运动速度减缓的趋势,可能是物质平衡持续亏损导致的冰川厚度变薄的直接结果.
参考文献(References):
[1]Solomon S,Qin Dahe,Manning M,et al.Climate Change 2007:The Physical Science Basis-Contribution of Working Group I to the Fourth Assessment Report of the Intergovernmental Panel on Climate Change[M].Cambridge,UK:Cambridge University Press,2007:16-72.
[2]Shi Yafeng.Glaciers and Their Environments in China:The Present,Past and Future[M].Beijing:Science Press,2000.[施雅风.中国冰川与环境——现在、过去和未来[M].北京:科学出版社,2000.]
[3]Roberts D H,Yde J C,Knudsen N T,et al.Ice marginal dynamics during surge activity,Kuannersuit Glacier,Disko Island,West Greenland[J].Quaternary Science Reviews,2009,28(3/4):209-222.
[4]Shangguan Donghui,Liu Shiyin,Ding Yongjian,et al.Surging glacier found in Shaksgam River,Karakorum Mountains[J].Journal of Glaciology and Geocryology,2005,27(5):641-644.[上官冬辉,刘时银,丁永建,等.喀喇昆仑山克勒青河谷近年来发现有跃动冰川[J].冰川冻土,2005,27(5):641-644.]
[5]Guo Wanqin,Liu Shiyin,Xu Junli,et al.Monitoring recent surging of the Yulinchuan Glacier on north slopes of Muztag Range by remote sensing[J].Journal of Glaciology and Geocryology,2012,34(4):765-774.[郭万钦,刘时银,许君利,等.木孜塔格西北坡鱼鳞川冰川跃动遥感监测[J].冰川冻土,2012,34(4):765-774.]
[6]Benn D I,Evans D J A.Glaciers and Glaciation[M].2nd ed.London:Arnold,2010.
[7]Paterson W S B.The Physics of Glaciers[M].3rd ed.Oxford,UK:Butterworth-Heinemann,1994.
[8]Cuffey K M,Paterson W S B.The Physics of Glaciers[M].4th ed.Oxford,UK:Elsevier,2009.
[9]Huang Maohuan,Sun Zuozhe.Some flow characteristics of continental-type glaciers in China[J].Journal of Glaciology and Geocryology,1982,4(2):35-45.[黄茂桓,孙作哲.我国大陆型冰川运动的某些特征[J].冰川冻土,1982,4(2):35-45.]
[10]Mayer C,Lambrecht A,Hagg W,et al.Post-drainage ice dam response at Lake Merzbacher,Inylchek Glacier,Kyrgyzstan[J].Geografiska Annaler:Series A,Physical Geography,2008,90(1):87-96.
[11]Qing Wenwu,Chen Rensheng,Liu Shiyin.Progress in study of glacier hygrological model[J].Advance in Water Science,2008,19(6):893-902.[卿文武,陈仁升,刘时银.冰川水文模拟研究进展[J].水科学进展,2008,19(6):893-902.]
[12]Cao Bo,Wang Jie,Zhang Chen,et al.The remote sensing in research of modern glacier changes[J].Remote Sensing Technology and Application,2011,26(1):52-59.[曹泊,王杰,张忱,等.遥感技术在现代冰川变化研究中的应用[J].遥感技术与应用,2011,26(1):52-59.]
[13]Luckman A,Quincey D,Bevan S.The potential of satellite radar interferometry and feature tracking for monitoring flow rates of Himalayan glaciers[J].Remote Sensing of Environment,2007,111(2/3):172-181.
[14]Cao Min,Li Zhongqin,Li Huilin.Features of the surface flow velocity on the Qingbingtan Glacier No.72,Tianshan Mountains[J].Journal of Glaciology and Geocryology,2011,33(1):21-29.[曹敏,李忠勤,李慧林.天山托木尔峰地区青冰滩72号冰川表面运动速度特征研究[J].冰川冻土,2011,33(1):21-29.]
[15]Joughin I,Smith B E,Howat I M,et al.Greenland flow variability from ice-sheet-wide velocity mapping[J].Journal of Glaciology,2010,56(197):415-430.
[16]Kääb A.Combination of SRTM3and repeat ASTER data for deriving alpine glacier flow velocities in the Bhutan Himalaya[J].Remote Sensing of Environment,2005,94(4):463-474.
[17]Jiang Zongli,Liu Shiyin,Xu Junli,et al.Using feature-tracking of ALOS PALSAR images to acquire the Yengisogat Glacier surface velocities[J].Journal of Glaciology and Geocryology,2011,33(3):512-518.[蒋宗立,刘时银,许君利,等.应用SAR特征匹配方法估计音苏盖提冰川表面流速[J].冰川冻土,2011,33(3):512-518.]
[18]Xu Junli,Zhang Shiqiang,Han Haidong,et al.Change of the surface velocity of Koxkar Baxi Glacier interpreted from remote sensing data,Tianshan Mountains[J].Journal of Glaciology and Geocryology,2011,33(2):268-275.[许君利,张世强,韩海东,等.天山托木尔峰科其喀尔巴西冰川表面运动速度特征分析[J].冰川冻土,2011,33(2):268-275.]
[19]Berthier E,Vadon H,Baratoux D,et al.Surface motion of mountain glaciers derived from satellite optical imagery[J].Remote Sensing of Environment,2005,95(1):14-28.
[20]Rignot E,Mouginot J,Scheuchl B.Ice flow of the Antarctic ice sheet[J].Science,2011,333:1427-1430.
[21]Jiao Keqin,Jing Zhefan,Han Tianding,et al.Variation of Glacier No.1at the headwaters of theÜrümqi River in the Tianshan Mountains during the past 42years and its trend prediction[J].Journal of Glaciology and Geocryology,2004,26(3):253-260.[焦克勤,井哲帆,韩添丁,等.42a来天山乌鲁木齐河源1号冰川变化及趋势预测[J].冰川冻土,2004,26(3):253-260.]
[22]Jing Zhefan.Movement and Variation of Several Typical Glaciers in China Under the Background of Climate Change[D].PhD Thesis,Lanzhou:Cold and Arid Regions Environmental and Engineering Research Institute,Chinese Academy of Sciences,2007.[井哲帆.气候变化背景下中国若干典型冰川的运动及其变化[D].兰州:中国科学院寒区旱区环境与工程研究所,2007.]
[23]Zhou Jianmin,Li Zhen,Li Xinwu.Research on rules of the valley glacier motion in western China based on ALOS/PALSAR interferometry[J].Acta Geodaetica et Cartographica Sinica,2009,38(4):341-347.[周建民,李震,李新武.基于ALOS/PALSAR雷达干涉数据的中国西部山谷冰川冰流运动规律研究[J].测绘学报,2009,38(4):341-347.]
[24]Jing Zhefan,Yao Tandong,Wang Ninglian.The surface flow features of the Puruogangri Ice Field[J].Journal of Glaciology and Geocryology,2003,25(3):288-290.[井哲帆,姚檀栋,王宁练.普若岗日冰原表面运动特征观测研究进展[J].冰川冻土,2003,25(3):288-290.]
[25]Sun Zuozhe,Huang Maohuan.The general features of glacier motion in the Qilian Mountains[C]//Memoirs of Lanzhou Institute of Glaciology and Geocryology,Chinese Academy of Sciences:No.5.Beijing:Science Press,1985:61-72.[孙作哲,黄茂桓.祁连山冰川运动的一般特征[C]//中国科学院兰州冰川冻土研究所集刊:第5号.北京:科学出版社,1985:61-72.]
[26]Jing Zhefan,Zhou Zaiming,Liu Li.Progress of the research on glacier velocities in China[J].Journal of Glaciology and Geocryology,2010,32(4):749-754.[井哲帆,周在明,刘力.中国冰川运动速度研究进展[J].冰川冻土,2010,32(4):749-754.]
[27]Jing Zhefan,Liu Li,Zhou Zaiming,et al.Analysis on the influencing factors of glacier flow velocity:A case study of Qiyi Glacier in Qilian Mountains[J].Journal of Glaciology and Geocryology,2011,33(6):1222-1228.[井哲帆,刘力,周在明,等.冰川运动速度影响因子的强度分析——以祁连山七一冰川为例[J].冰川冻土,2011,33(6):1222-1228.]
[28]Wang Zongtai,Liu Chaohai,You Genxiang,et al.Glacier Inventory of China:I.Qilian Mountains[M].Lanzhou:Lanzhou Institute of Glaciology and Geocryology,Chinese A-cademy of Sciences,1981.[王宗太,刘潮海,尤根祥,等.中国冰川目录:I.祁连山区[M].兰州:中国科学院兰州冰川冻土研究所,1981.]
[29]Cao Bo.Glacier Changes in the Lenglongling Mountain,Eastern Qilian Shan[D].PhD Thesis,Lanzhou:Lanzhou University,2013.[曹泊.祁连山东段冷龙岭现代冰川变化研究[D].博士论文,兰州:兰州大学,2013.]
[30]Pan Baotian,Cao Bo,Wang Jie,et al.Glacier variations in response to climate change from 1972to 2007in the western Lenglongling Mountains,northeastern Tibetan Plateau[J].Journal of Glaciology,2012,58(211):879-888.
[31]Rivera A,Casassa G,Bamber J,et al.Ice-elevation changes of Glaciar Chico,southern Patagonia,using ASTER DEMs,aerial photographs and GPS data[J].Journal of Glaciology,2005,51(172):105-112.
[32]Li Jing,Liu Shiyin,Shangguan Donghui,et al.Identification of ice elevation change of the Shuiguan River No.4Glacier in the Qilian Mountains,China[J].Journal of Mountain Science,2010,7(4):375-379.
[33]Zhang Guoliang.The Study of Glacier Changes in the Gongga Mountains[D].PhD Thesis,Lanzhou:Lanzhou University,2012.[张国梁.贡嘎山地区现代冰川变化研究[D].博士论文,兰州:兰州大学,2012.]
[34]Jing Zhefan,Ye Baisheng,Jiao Keqin,et al.Surface velocity on the Glacier No.51at Haxilegen of the Kuytun River,Tianshan Mountains[J].Journal of Glaciology and Geocryology,2002,24(5):563-566.[井哲帆,叶柏生,焦克勤,等.天山奎屯河哈希勒根51号冰川表面运动特征分析[J].冰川冻土,2002,24(5):563-566.]
[35]Liu Yushuo,Qin Xiang,Du Wentao,et al.Analysis of the movement features of the Laohugou Glacier No.12in the Qilian Mountains[J].Journal of Glaciology and Geocryology,2010,32(3):475-479.[刘宇硕,秦翔,杜文涛,等.祁连山老虎沟12号冰川运动特征分析[J].冰川冻土,2010,32(3):475-479.]
[36]Li Zongqin,Han Tianding,Jing Zhefan,et al.A summary of 40-year observed variation facts of climate and Glacier No.1at headwater ofÜrümqi River,Tianshan,China[J].Journal of Glaciology and Geocryology,2003,25(2):117-123.[李忠勤,韩添丁,井哲帆,等.乌鲁木齐河源区气候变化和1号冰川40a观测事实[J].冰川冻土,2003,25(2):117-123.]
[37]Xie Zichu,Liu Chaohai.Introduction of Glaciology[M].Shanghai:Shanghai Popular Science Press,2010.[谢自楚,刘潮海.冰川学导论[M].上海:上海科学普及出版社,2010.]
[38]Yao Tandong,Thompson L,Yang Wei,et al.Different glacier status with atmospheric circulations in Tibetan Plateau and surroundings[J].Nature Climate Change,2012,2:663-667.
[39]Li Xin,Cheng Guodong,Jin Huijun,et al.Cryospheric change in China[J].Global and Planetary Change,2008,62(3/4):210-218.
[40]Zhou Zaiming,Jing Zhefan,Zhao Shuhui,et al.The response of glacier velocity to climate change:A case study ofÜrümqi Glacier No.1[J].Acta Geoscientica Sinica,2010,31(2):237-244.[周在明,井哲帆,赵淑慧,等.冰川运动速度对气候变化的响应——以天山乌鲁木齐河源1号冰川为例[J].地球学报,2010,31(2):237-244.]
Surface Flow Velocities of the Ningchanhe No.1and Shuiguanhe No.4 Glaciers in the East Qilian Mountains
Abstract:The glacier melt water in the northern slopes of the Lenglongling Mountain,located in the East Qilian Mountains,is the main water supply to the Hexi Corridor.However,there is little observation data about the modern glaciers'surface flow velocities in this area.So,the Ningchanhe No.1(NC No.1)Glacier and the Shuiguanhe No.4(SG No.4)Glacier surface flow velocities were investigated by surveying stakes on the glacier surfaces.The annual mean surface flow velocity of the SG No.4Glacier(5.2m·a-1)was higher than that of the NC No.1Glacier(2.8m·a-1)during 2010-2012,due to the glacierized area of the former lager than that of the later.The maxi-mum surface flow velocity of the SG No.4Glacier appeared at the higher elevation of the observed area(close to the equilibrium line altitude),while the maximum velocity of the NC No.1Glacier presented in the region with steeper slope.This shows that the maximum velocity of the glaciers commonly appears in the region close to the equilibrium line altitude;however,some topographic factors,such as slope etc.,should be taken into consideration.Compared with the historical data,it is found that there is decreasing tendency of the annual mean surface flow velocity on the SG No.4 Glacier,which may be attributed to the glacier thinning as a result of continuous loss of mass.
Key words:Lenglongling Mountain;Ningchanhe No.1Glacier;Shuiguanhe No.4Glacier;glacier surface flow velocity
中图分类号:P343.6
文献标识码:A
doi:10.7522/j.issn.1000-0240.2013.0158
Cao Bo,Wang Jie,Pan Baotian,et al.Surface flow velocities of the Ningchanhe No.1and Shuiguanhe No.4Glaciers in the East Qilian Mountains[J].Journal of Glaciology and Geocryology,2013,35(6):1428-1435.[曹泊,王杰,潘保田,等.祁连山东段宁缠河1号冰川和水管河4号冰川表面运动速度研究[J].冰川冻土,2013,35(6):1428-1435.]
收稿日期:2013-07-07;
修订日期:2013-09-10
基金项目:科技部基础性工作专项基金项目(2013FY111400);国家自然科学基金重大研究计划项目(91125008);教育部博士研究生学术新人奖;中央高校基本科研业务费专项资金项目(LZUJBKY-2013-125)资助
*
致谢:吉亚鹏、姜少飞、张忱、黄波、刘芬良、陈殿宝、李富强和卢耀洋等在野外工作中给予了帮助,在此一并表示感谢.