东昆仑山煤矿冰川雷达测厚及冰储量估算
【类型】期刊
【作者】李亚楠,李真,王宁练(中国科学院西北生态环境资源研究院冰冻圈科学国家重点实验室;中国科学院大学;西北大学城市与环境学院)
【作者单位】中国科学院西北生态环境资源研究院冰冻圈科学国家重点实验室;中国科学院大学;西北大学城市与环境学院
【刊名】冰川冻土
【关键词】 探地雷达(GPR);煤矿冰川;东昆仑山;冰川厚度;冰储量
【资助项】中国西部主要冰川作用中心冰量变化调查项目(2013FY111400);国家自然科学基金项目(41190084,41501069);冰冻圈科学国家重点实验室开放基金项目(SKLCS-OP...
【ISSN号】1000-0240
【页码】P38-46
【年份】2019
【期号】第1期
【期刊卷】1;|7;|8;|2
【摘要】基于2015年5月东昆仑山煤矿冰川冰厚测量资料,结合2015年Landsat8 OLI影像,利用Ordinary Kriging插值方法对冰川非测厚区进行插值计算,绘制了该冰川厚度等值线并对该冰川冰储量进行了估算。2015年煤矿冰川最大厚度为87 m,位于海拔4 952 m主流线附近,平均厚度为25.77 m,冰储量为0.0242 km~3。利用煤矿冰川冰面地形图与冰厚度分布图,获得该冰川冰床地形图。结果显示,冰川上宽下窄沿山谷分布,冰床地形复杂,在冰厚较大区域,地形呈近“V”字分布,显示了冰斗冰川的形貌特征。
【全文】 文献传递
东昆仑山煤矿冰川雷达测厚及冰储量估算
摘 要: 基于2015年5月东昆仑山煤矿冰川冰厚测量资料, 结合2015年Landsat8 OLI影像, 利用Ordinary Kriging插值方法对冰川非测厚区进行插值计算, 绘制了该冰川厚度等值线并对该冰川冰储量进行了估算。2015年煤矿冰川最大厚度为87 m, 位于海拔4 952 m主流线附近, 平均厚度为25.77 m, 冰储量为0.0242 km3。利用煤矿冰川冰面地形图与冰厚度分布图, 获得该冰川冰床地形图。结果显示, 冰川上宽下窄沿山谷分布, 冰床地形复杂, 在冰厚较大区域, 地形呈近“V”字分布, 显示了冰斗冰川的形貌特征。
关键词: 探地雷达(GPR); 煤矿冰川; 东昆仑山; 冰川厚度; 冰储量
0 引言
青藏高原山地冰川是我国西北地区重要的地表水资源, 准确评估山地冰川储量及其变化对于受冰川融水影响的下游地区国民经济建设及相关政策的制定具有重要的现实意义[1]。冰川厚度是评估冰川储量的基本参数, 同时, 冰川厚度变化作为山地冰川与气候系统相互作用的重要反馈形式具有高度敏感性, 准确获得其时空变化对于指示青藏高原地区气候变化及冰川动力学过程具有重要科学意义[2-4]。早期冰川学家利用冰川动力学[5-11]和重力测量[12-15]等方法估算冰川厚度, 但这些方法中较多的冰川物理参数难于获得, 应用范围受到极大限制。冰川雷达测厚技术始于20世纪20年代[16], 至20世纪60年代中后期得到系统发展, 在极地和山地冰厚测量等研究中得到广泛应用[17-23]。我国于20世纪80年代研制了B-1型冰川测厚雷达[24], 在青藏高原开展了一系列冰厚测量工作, 为我国山地冰川冰储量估算奠定了重要基础[25-29]。近10年来, 探地雷达测厚技术在天山、 喜马拉雅山、 念青唐古拉山和祁连山等冰川研究区域得到一系列应用[30-39], 获得一批宝贵的冰川厚度和冰储量数据。但相对于我国冰川总量而言, 目前所积累的冰川厚度和冰储量数据依旧稀缺。本文基于2015年5月利用加拿大SSI公司pulse EKKO PRO探地雷达系统(Ground Penetrating Radar, 简称GPR)对昆仑山东段的煤矿冰川厚度测量结果, 分析煤矿冰川的厚度状况、 冰储量以及冰下基岩地形分布特征。
1 研究区概况
煤矿冰川(35°40′ N, 94°11′ E, 第二次冰川编目号为G094184E35669N)位于昆仑山东段西大滩唐格乌拉山北坡, 冰川朝向北, 冰川融水隶属西大滩柴达木内陆水系, 汇入本区第二条较大河流格尔木河西支的昆仑河。该冰川是一个发育于山地的冰斗型冰川, 根据第二次冰川编目资料[29], 煤矿冰川平均坡度23.5°, 平均长度1.8 km, 面积1.18 km2, 平均厚度45 m, 冰储量为0.0531 km3。煤矿冰川是中国具有最长野外观测时间的冰川之一[40-41], 冰川物质平衡研究表明煤矿冰川在1990s中期物质平衡状态由正转为负[42]。
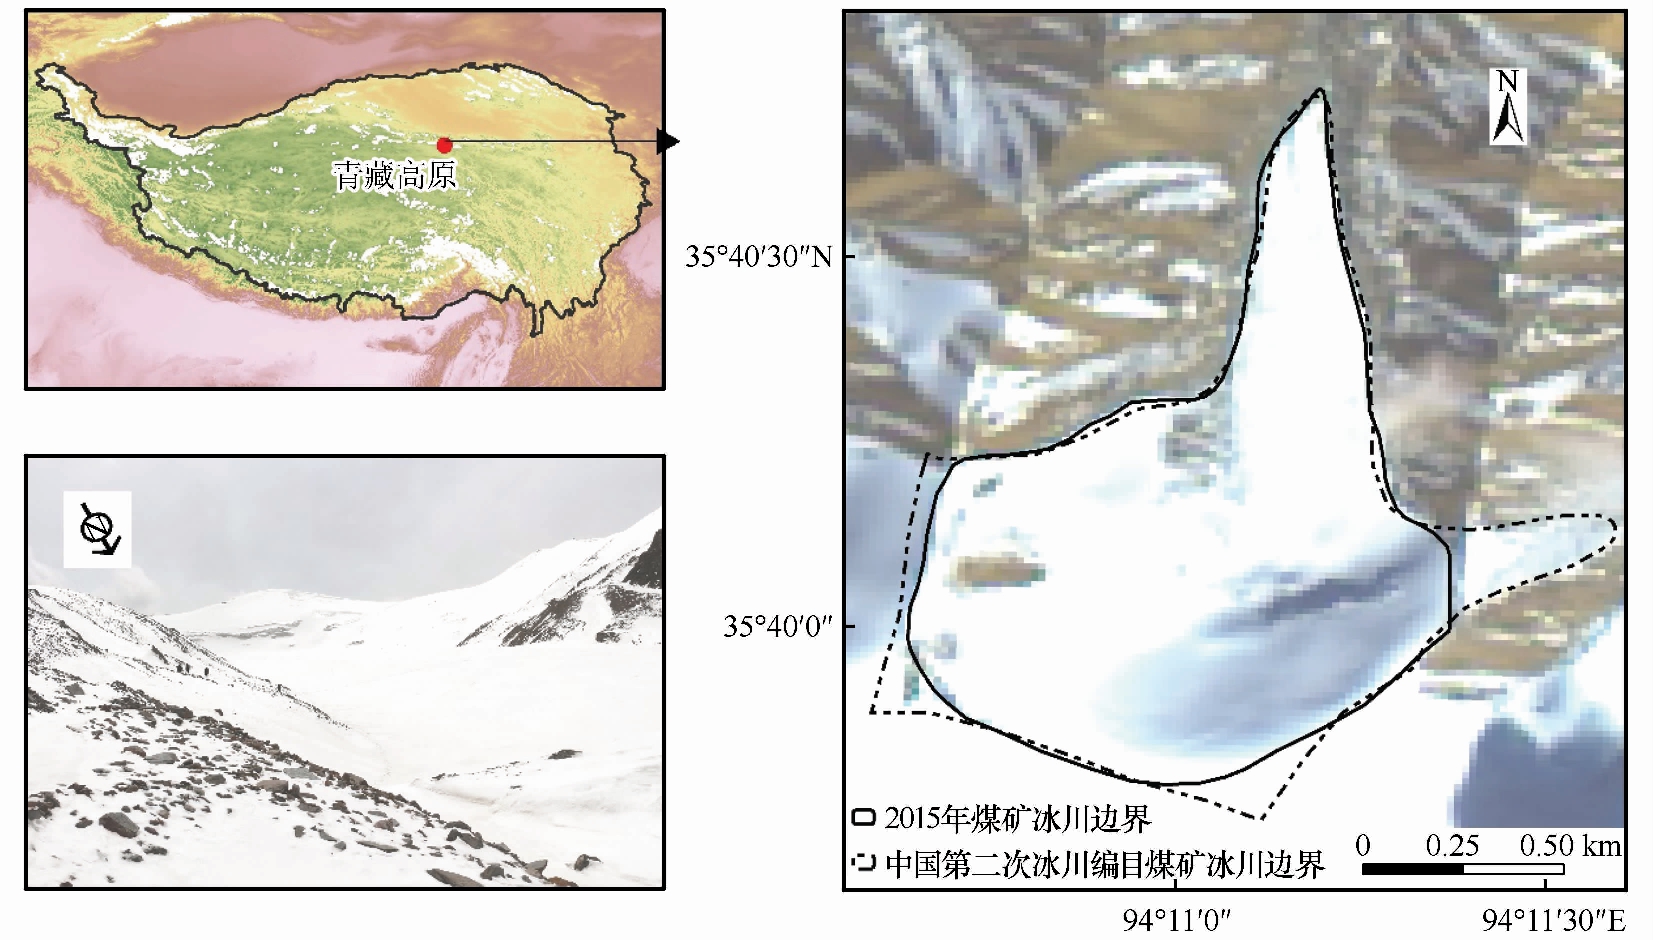
图1 东昆仑山煤矿冰川位置及冰川边界(右图底图显示的是2015年10月11号Landsat8 OLI影像, 黑色虚线是第二次冰川编目中煤矿冰川边界, 黑色实线是本文利用遥感数据获得煤矿冰川边界)
Fig.1 Location of the Meikuang Glacier on the northeastern of the Tibetan Plateau (The panel at right shows the RGB images of Landsat8 OLI on 11 October 2015; the black dotted line around the glacier indicates the extent of the glacier in the Second Chinese Glacier Inventory and the black solid line represents the extent of the glacier from remote-sensing)
2 资料获取与方法
为了获得煤矿冰川厚度及冰储量值, 2015年5月基于冰川表面形态及人力可到达范围完成了1条纵测线和5条横测线的雷达探测, 测点共计115个。纵测线海拔范围4 861~5 150 m, 基本沿冰川主流线布设; 横测线分别布设冰川区内5个不同海拔高度区, 分别为4 880 m、 4 930 m、 5 000 m、 5 030 m、 5 080 m(图2)。测量时雷达采用100 MHz天线, 天线间距设置为2 m, 采样时间间距为0.8 ns, 测点间隔为20 m, 电磁波在冰川中的传播速度取0.169 m·ns-1, 同步利用便携式GPS进行定位。该套雷达系统及设定参数曾在祁连山八一冰川测厚中应用, 测厚结果与同点透底冰芯的长度对比相对误差小于1%[1]。
遥感具有大尺度、 快速监测能力, 利用遥感与实测相结合的方法研究青藏高原变化已成为常用手段[43-44]。本文采用由遥感资料获取的范围作为冰川边界, 根据2015年10月11号Landsat8 OLI卫星数据预处理及全色波段15 m分辨率重采样原始数据(30 m分辨率), 利用重采样之后可见光与近红外波段15 m分辨率影像计算Normalized Difference Snow Index (NDSI), 设定阈值0.67获得煤矿冰川边界; 再根据美国国家航空航天局(NASA)2014年9月发布的Shuttle Radar Topography Mission
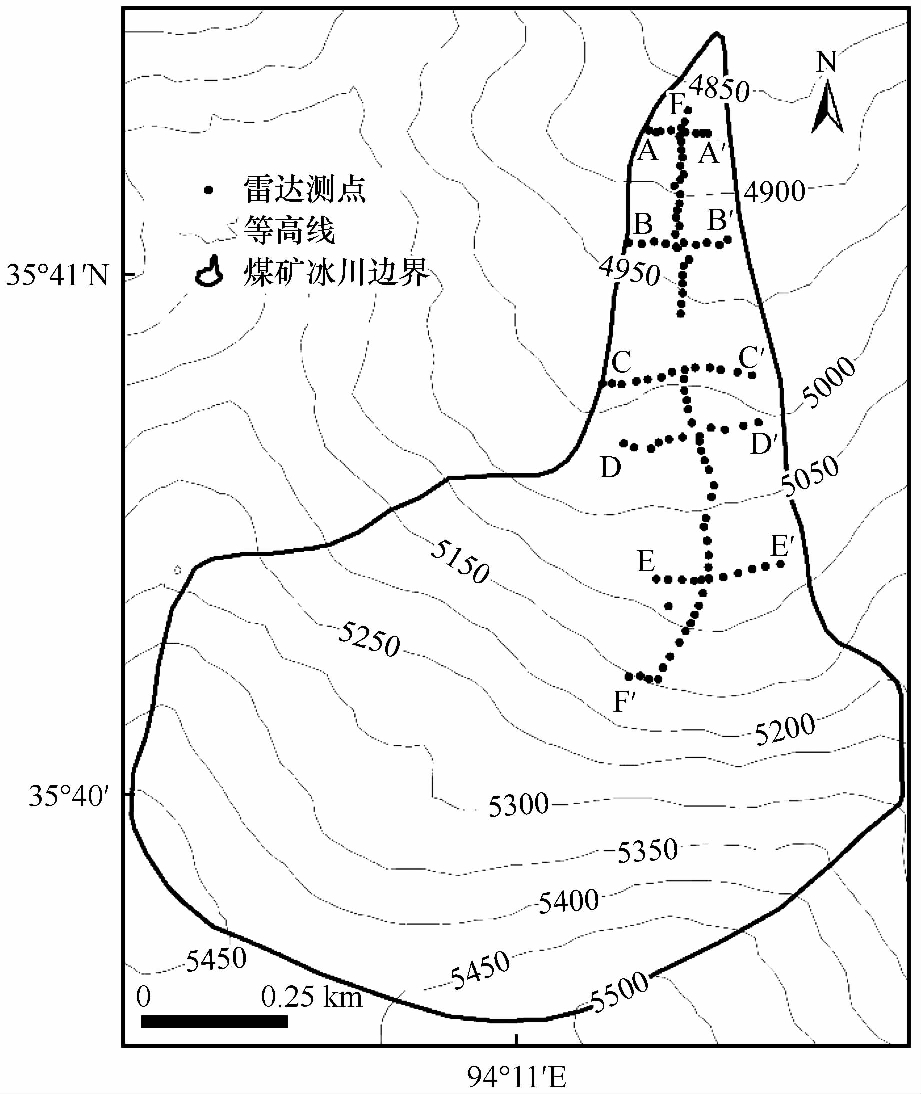
图2 东昆仑山煤矿冰川雷达测厚测线分布
Fig.2 The GPR sounding routes on the Meikuang Glacier, Eastern Kunlun Mountains
(SRTM) 30 m分辨率地形数据利用ArcGIS 10.2.1计算煤矿冰川集水区域, 结合目视解译修正冰川边界。现阶段, 煤矿冰川分布在海拔4 827~5 507 m之间, 最大长度1.9 km, 冰川面积为0.95 km2, 最大坡度45.6°位于冰川上半部分, 平均坡度24.12°。
利用煤矿各测线的探地雷达图像资料, 可以获得所有测线测量点处的冰厚度数据。雷达测厚点未均匀分布整个冰川表面, 本文利用ArcGIS工作平台, 对煤矿冰川测厚区及整个冰川区分别进行Ordinary Kriging[45]插值处理, 以获得更加准确的冰厚及冰储量数据。对于测厚区, 以测点处冰川边界作为下边界、 最高测点5 150 m等高线作为测厚区上边界; 下边界布设若干冰厚度为零值的点[1,35], 上边界处冰面坡度、 地形与最高测点相似, 在上边界处设置点厚度与最高测点厚度一致; 对于整个冰川区, 将冰川边界线处的冰厚值设置为零, 根据测点数据均匀设置零值点个数, 使插值点满足正态分布。 基于探地雷达测厚和冰川边界冰厚度零值点数据, 利用Ordinary Kriging插值法将实测冰厚数据进行栅格化处理并计算平均厚度, 保持空间分辨率与SRTM一致(30 m×30 m); 再利用冰厚栅格数据, 绘制出煤矿冰川10 m间距冰厚等值线分布图, 对研究区积分获得该冰川冰储量; 最后将冰面高程栅格数据SRTM与冰厚度栅格数据相结合, 得到冰下地形高程数据, 据此研究煤矿冰川冰床地形特征。
3 结果与讨论
3.1 冰川纵测线厚度分布特征
图3(a)为煤矿冰川沿冰川主流线附近由海拔5 000~5 120 m一段纵测线的雷达厚度图像, 冰川与基岩界面清晰可见。将同步GPS测得表面高程数据进行地形校正后, 引入雷达测厚结果, 获得纵测线冰川表面和冰下基岩地形图, 如图3(b)所示。可以看出, 煤矿冰川冰厚自末端向上由薄变厚再至薄。煤矿冰川两个厚度大值区, 在海拔4 952 m处测得的最大冰川厚度值87 m, 另一厚度较大值出现在海拔5 073 m附近, 冰川厚度约为70 m。在两个冰厚大值之间, 冰下基岩存在一个凸起区域, 上下都是凹陷地形, 此处雷达信号较为复杂, 可能由于冰蚀产生的岩石碎屑积累造成雷达波信号多次反射, 使得信号图像上层有连续噪音。MacGregor等[46]曾指出, 沿冰川主流线, 山地冰川的底部滑动速度和水压波动会在平衡线附近达到峰值, 冰川通过瞬时平衡线处冰厚度增加和底部滑动加速来平衡运动, 使得此处伴随着最快速的侵蚀速率。对煤矿冰川而言, 平衡线多年在海拔5 040~5 135 m之间变化[40-41], 可能正是冰川平衡线高度的上下波动, 致使这一高度范围的冰床基岩受冰川高速流动的反复侵蚀, 在海拔4 952 m和5 073 m附近形成两个冰厚大值区。
煤矿冰川主流线冰面地形和冰下基岩地形起伏状况分布不一致, 基岩起伏状况剧烈, 冰面地形在海拔4 940~4 950 m较为平坦, 其他区域表面坡度分布较均匀, 说明基岩起伏对冰面形态影响被冰川运动削弱了。冰下基岩地形起伏特征明显强于冰面地形状况, 反映了冰床基岩在冰川运动过程中经受剧烈的磨蚀和拔蚀等作用[5]。
3.2 冰川横测线厚度分布特征
煤矿冰川五条横测线分别位于海拔 4 880 m、 4 930 m、 5 000 m、 5 030 m、 5 080 m处。利用同步GPS测得表面高程数据和雷达测厚结果, 获得横测线冰川表面和冰下基岩地形图(图4)。可以看出, 由低海拔向高海拔, 冰川槽谷形态由“V”字形向近“U”字形变化, 槽谷宽深比依次减小。研究表明, 冰川发育以侧蚀为主, 下蚀作用相对较弱[47-51]。上部5 030 m和5 080 m处两条横测线结果表明槽谷两壁对冰川阻力减小了冰川中部形变, 使得冰川中央底部的侵蚀速率小于两侧, 从而冰川槽谷会缓慢拓宽变为“U”型。此外, 冰川横测线剖面图清晰突出冰岩槽谷形态, 煤矿冰川沿主流线东西侧槽谷形态与坡度随海拔变化幅度大, 将来可以借此来分析槽谷形态与冰川流动的相互作用, 深化冰川物理特征及冰川流动研究。
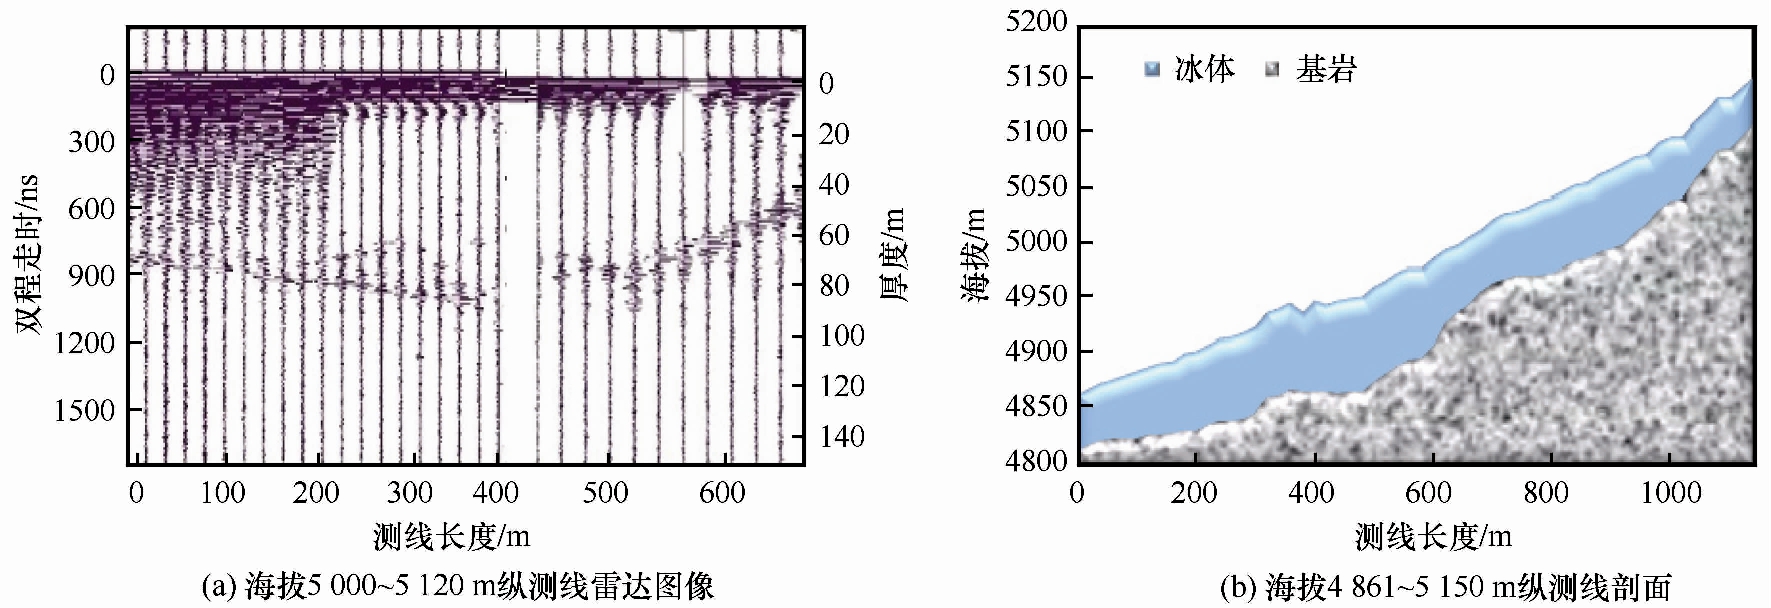
图3 东昆仑山煤矿冰川纵测线雷达测厚资料
Fig.3 GPR profiles along the sounding transect which close to the main flow line of the Meikuang Glacier, Eastern Kunlun Mountains, (a) longitudinal GPR profile between 5 000~5 120 m and (b) longitudinal glacier profile between 4 861~5 150 m
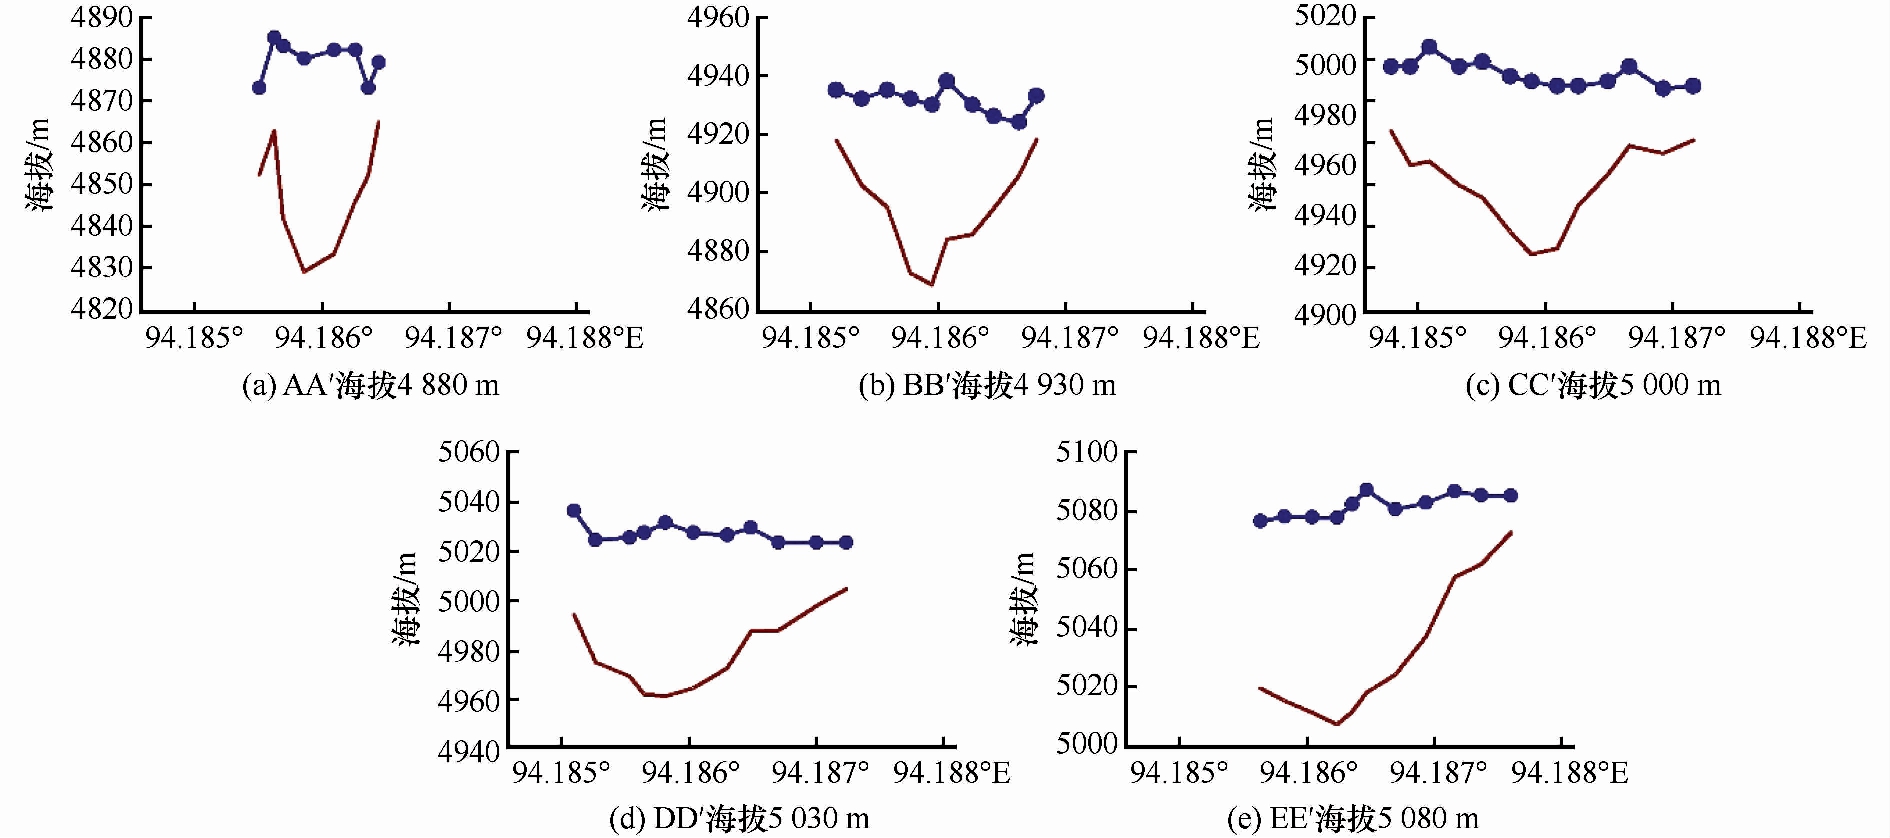
图4 东昆仑山煤矿冰川不同海拔高度处横测线雷达图像资料 (蓝色线条表示冰面高程, 红色线条表示冰下基岩, 圆点表示雷达实测点)
Fig.4 GPR profiles along the sounding transect on the Meikuang Glacier (the blue lines referring to the ice surface elevations, the red lines referring to the subglacial base elevations and the blue dots referring to the souding points)
3.3 冰川厚度分布与冰储量计算及冰下地形
本文利用Ordinary Kriging插值获得煤矿冰川平均厚度。由于煤矿冰川粒雪盆后壁陡峭, 上部冰川区未能获得实测冰厚数据。鉴于邻近测点和上部冰川具有相似的坡度且冰川厚度与海拔具有很好的相关性, 因此利用临近上部冰川的实测点冰厚数据, 对未能测量的煤矿冰川上部区冰厚进行rational曲线拟合, 如图5, 得到上部冰川冰厚随海拔变化曲线:
H=7623/(E-4963)
(1)
式中: H表示厚度; E表示海拔; R2为0.975, RMSE为1.272 m。
据此获得上部冰川沿主流线冰厚度平均值为23.30 m, 冰川顶部5 420 m处为16.68 m。利用Ordinary Kriging插值获得煤矿冰川平均厚度为25.77 m, 交叉验证误差约为3.60 m, 测厚区平均厚度36.48 m, 交叉验证误差约为0.93 m。
图6是昆仑山西大滩煤矿冰川测厚区及整条冰川冰厚等值线分布图。在冰川厚度实测区, 等值线图在冰川下部主流线处有三个封闭区, 冰厚分别为70 m、 70 m和80 m。整体来看, 煤矿冰川冰厚随着主流线自冰川末端由薄快速变厚再逐渐减薄, 上端浅薄, 下部深厚, 且自边缘到主流线方向迅速增厚, 具有冰斗型冰川厚度的典型分布特征。
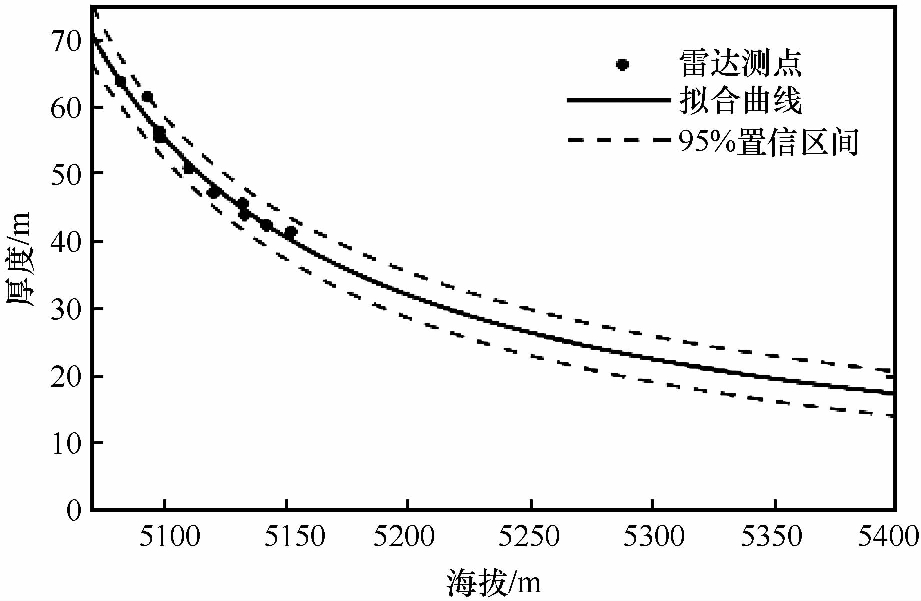
图5 雷达纵测线上部测厚点拟合曲线
Fig.5 Glacier thickness profile of the upper Meikuang Glacier: rational fitting curve of the upper 12 sounded points (dots)
基于冰厚及冰川边界积分, 分别获得雷达测厚区冰储量为0.0112 km3, 冰川冰储量为0.0242 km3(表1)。与两次冰川编目资料相比, 煤矿冰川面积比第一次冰川编目面积减少约0.23 km2, 比第二次冰川编目面积减少0.1 km2, 冰储量分别减少了约0.029 km3和0.015 km3, 相当于自20世纪60年代以来煤矿冰川储量减少了一半。煤矿冰川冰储量减少如此显著, 尽管有这一时期气候变化的贡献[38-40], 但本文研究显示计算方法是导致巨量差异的主要原因。首先, 冰川编目中煤矿冰川的面积偏大, 实际面积并不包括编目资料中的右侧凸起小分支(图1)。煤矿冰川由于历史时期的退缩, 在紧接冰舌前端形成高大的终碛丘和半圈状冰碛垄, 和周围山脊形成环形, 冰川前端仅有一个狭小出口, 大量积雪和融水累积在末端, 导致煤矿冰川面积变化并不明显, 1990年至今的遥感影像也显示出此特征。其次, 冰川编目中冰川厚度主要根据经验公式推算, 与真实值有时差距很大。第二次冰川编目中煤矿冰川2006年平均厚度约为45 m, 2015年实测平均厚度约为25 m, 在冰川面积几乎不变的情况下, 10年内冰厚度减少20 m不可想象。冰储量主要根据面积-体积经验公式获得, Liu等[52]2015年研究中国冰川现状, 利用Radi 等[53]总结的冰川体积-面积估算经验公式作为参考:
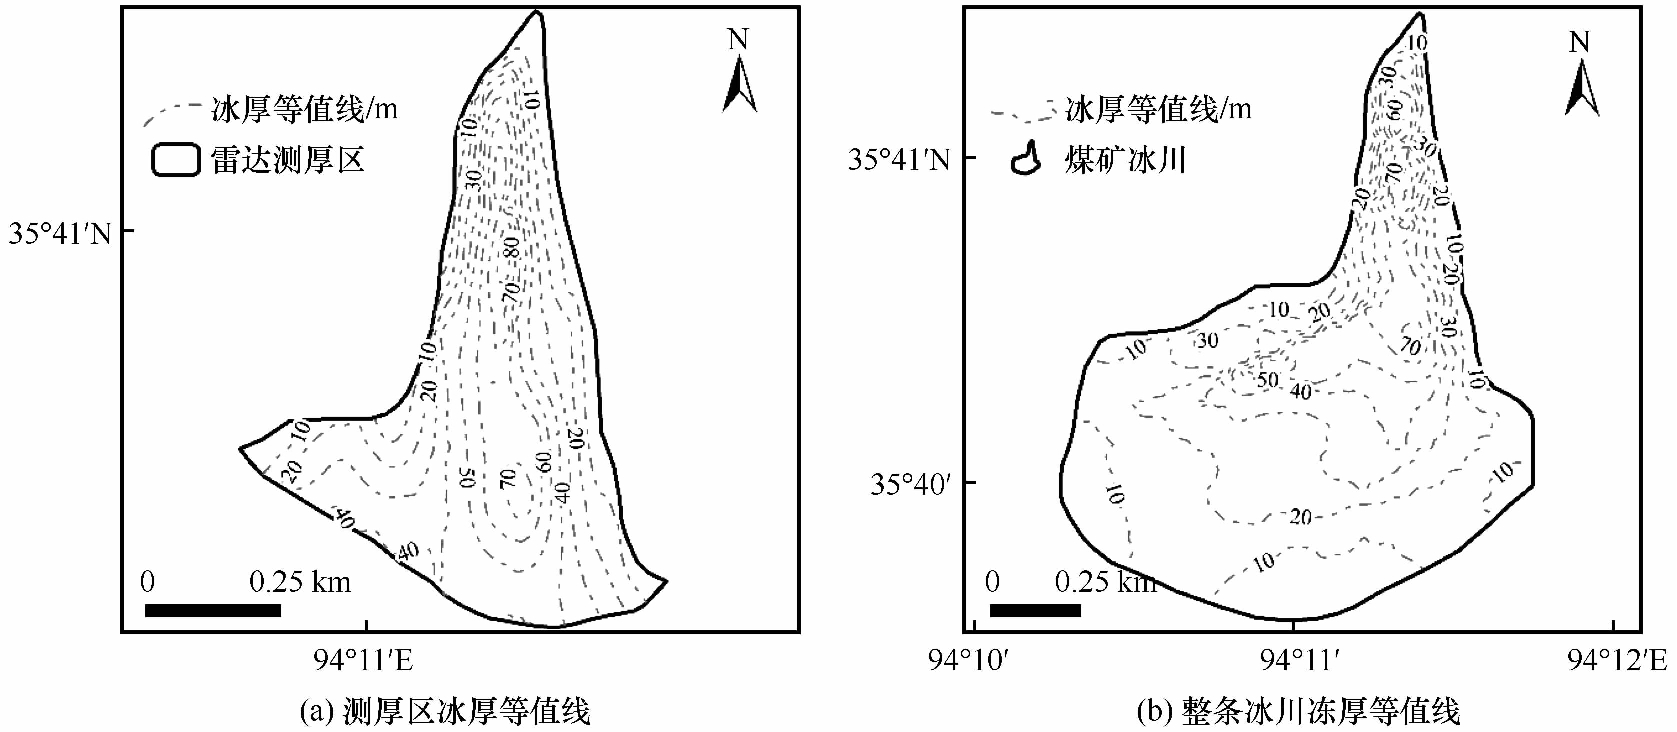
图6 东昆仑山煤矿冰川冰厚等值线
Fig.6 The ice thickness contours of the Meikuang Glacier in the Eastern Kunlun Mountains, (a) ice thickness contours of the sounded area; (b) ice thickness contours of the whole glacier
表1 探地雷达测量的煤矿冰川平均冰厚及冰储量与两次冰川编目中冰川平均厚度和冰储量对比
Table 1 Average glacier thickness, together with ice volume, of the Meikuang Glacier from GPR, compared with those recorded in the two Chinese Glacier Inventories

测量日期面积/km2平均厚度/m冰储量/km3经验公式估算/km3一次冰川编目1969年1.18无0.05310.0458二次冰川编目2006年1.0545.000.03920.0390雷达测厚区2015年5月0.3136.480.0112-整条冰川2015年5月0.9525.770.02420.0340
V=0.0365S1.375
(2)
式中: V为冰储量(km3); S为冰川面积(km2)。
式(2)采用1997年Bahr等[54]提出的适用于山地冰川具有物理含义的1.375次方参数, 与Liu等[55]根据中国山地冰川实测数据提出的系数很接近。表2是利用式(2)计算的青藏高原有雷达实测冰厚数据的部分冰川的冰储量, 根据公式计算冰量比探地雷达实测冰储量大或者相似。根据表2, 可以看出, 煤矿冰川经验公式冰储量计算值为0.034 km3, 比实测值高出近三分之一, 抗物热冰川和四工河4号冰川公式计算值约是实测值的一倍, 而八一冰川、 古仁河口冰川和扎当冰川结果则相近。这说明不同区域、 不同类型冰川冰储量计算的不确定性影响因素很大, 在我国两次冰川编目中46 377条冰川的巨大总量下, 自动冰川边界提取及基于经验公式的平均厚度计算切实可行, 但在具体单条冰川研究过程中需要获得更精确的冰川边界和冰储量, 减小研究不确定性。
结合冰面SRTM高程栅格数据与冰厚度栅格数据, 得到冰下地形高程数据(图7), 从图7中可以看出, 煤矿冰川在主流线处地形坡度小, 在海拔5 300 m附近及海拔5 000 m以下区域地形尤为平坦, 并且与冰面地形(图2)几乎相一致, 这是冰斗冰川的一个特点。在分别对测厚区和整条冰川处理分析中发现, 两者可以较为一致的获得冰川厚度及冰床地形数据, 尤其在海拔5 200~5 350m没有测厚数据情况下, 插值结果表现出此处的平坦地形, 与野外实地勘察情况一致, 也进一步说明该处冰川厚度的处理方法是可信的。
表2 青藏高原部分冰川探地雷达平均冰厚及冰储量与经验公式计算冰储量对比
Table 2 Average ice thicknesses and ice volumes, sounded with GPR, of some glaciers on the Tibetan Plateau, compared with the ice volumes calculated from area-volume scales

测量日期面积/km2平均厚度/m冰储量/km3经验公式估算/km3资料来源煤矿冰川2015年5月0.9525.770.02420.0340本文古仁河口冰川2007年5月1.2036.000.04470.0469马凌龙等[36]祁连山八一冰川2006年5月2.8154.200.15300.1511王宁练等[1]抗物热冰川2007年9月1.9647.300.05170.0921马凌龙等[32]四工河4号冰川2009年夏3.3327.600.0760.1908王璞玉等[39]扎当冰川2011年5月1.7338.100.0660.0776朱美林等[34]
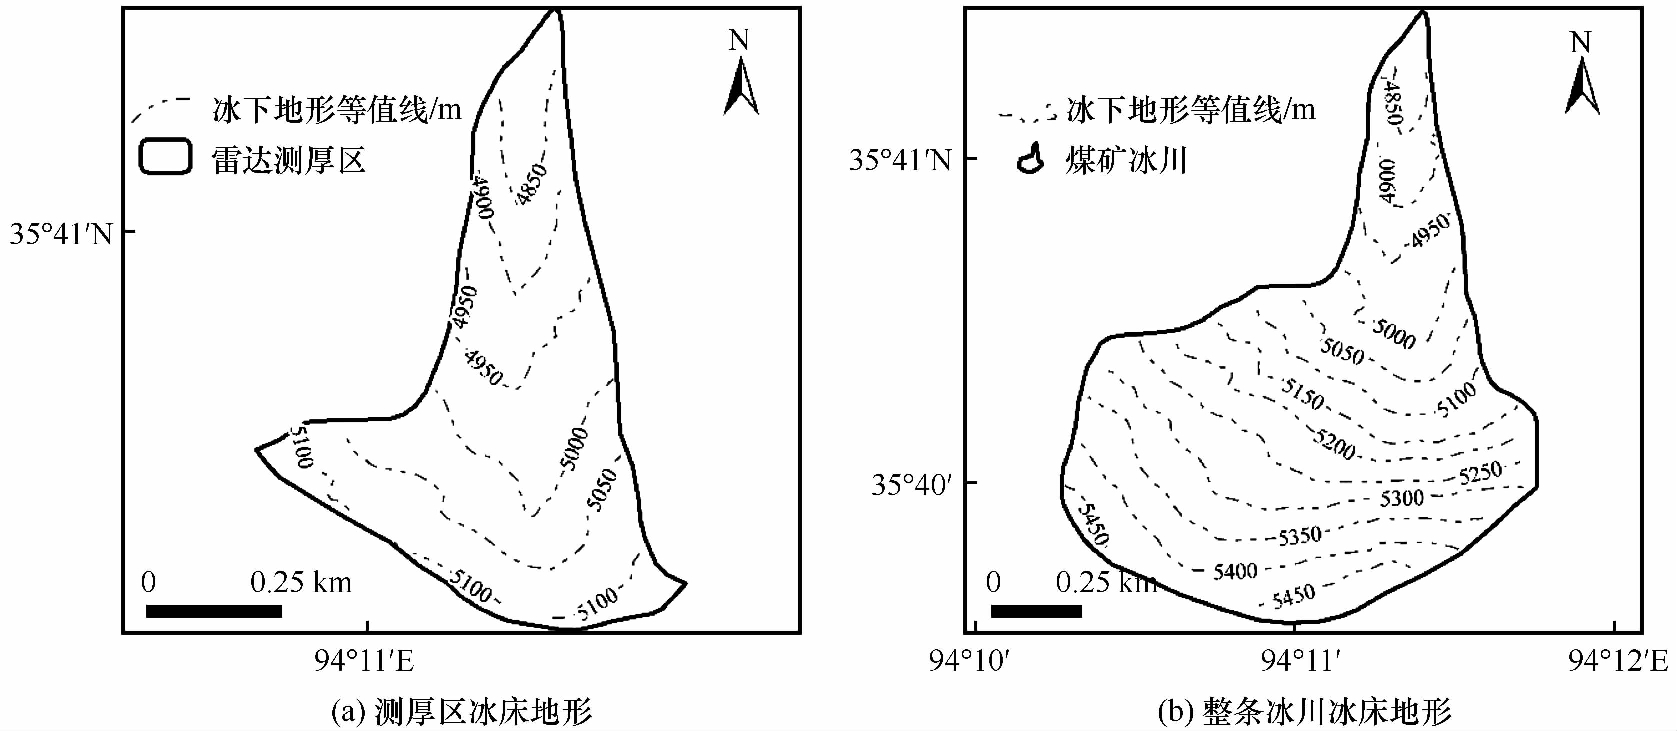
图7 东昆仑山煤矿冰川冰床地形
Fig.7 Map showing the bed landform of the Meikuang Glacier, Eastern Kunlun Mountains, (a) the bed landform of the measured area; (b) the bed landform of the whole glacier
4 结论
本文利用2015年Landsat8 OLI影像和2015年5月GPR测量冰川厚度数据以及与冰厚测点同步的GPS位置数据, 采用Ordinary Kriging插值方法, 分别对测厚区和整条冰川进行了冰厚重建; 然后利用30 m分辨率SRTM数据及冰厚分布图, 获得了煤矿冰川冰床地形图; 最后将实测结果与编目资料对比, 分析差别与原因。主要结论如下:
(1) 冰川雷达探测技术从上世纪发展至今, 为准确估算冰川变化及水资源评估提供了可靠的技术方法。2015年探地雷达测厚结果显示, 煤矿冰川平均厚度为25.77 m, 最大厚度为87 m, 位于海拔4 952 m 主流线附近, 冰川面积为0.95 km2, 冰储量约为0.0242 km3。
(2) 煤矿冰川具有典型的冰斗冰川形态, 上部宽阔下部狭窄, 下伏地形起伏剧烈, 槽谷形态呈“V”形发育, 且冰川沿主流线方向发生溯源和下蚀侵蚀, 在4 952~5 030 m处形成了围椅状凹地。
(3) 冰川编目中煤矿冰川冰储量几乎是2015年实测储量的两倍, 说明经验公式在单条冰川精确冰储量估算中存在很多不确定性。因此, 未来冰川储量的估算不仅需要改进大区域冰川边界自动提取精度, 还需要大量的冰厚实测资料来建立不同类型、 不同形态的冰川冰厚与其重要参数的定量关系。
参考文献 (References):
[1] Wang Ninglian, Pu Jianchen. Ice thickness, sounded by ground penetrating radar, on the Bayi Glacier in the Qilian Mountains, China[J]. Journal of Glaciology and Geocryology, 2009, 31(3): 431-435. [王宁练, 蒲建辰. 祁连山八一冰川雷达测厚与冰储量分析[J]. 冰川冻土, 2009, 31(3): 431-435.]
[2] Ding Yongjian, Xiao Cunde. Challenges in the study of cryospheric changes and their impacts[J]. Advances in Earth Science, 2013, 28(10): 1067-1076. [丁永建, 效存德. 冰冻圈变化及其影响研究的主要科学问题概论[J]. 地球科学进展, 2013, 28(10): 1067-1076.]
[3] Yao Tandong, Qin Dahe, Shen Yongping, et al. Cryospheric changes and their impacts on regional water cycle and ecological conditions in the Qinghai-Tibetan Plateau[J]. Chinese Journal of Nature, 2013, 35(3): 179-186. [姚檀栋, 秦大河, 沈永平, 等. 青藏高原冰冻圈变化及其对区域水循环和生态条件的影响[J]. 自然杂志, 2013, 35(3): 179-186.]
[4] Yao Tandong, Thompson L, Yang Wei, et al. Different glacier status with atmospheric circulations in Tibetan Plateau and surroundings[J]. Nature Climate Change, 2012, 2(9): 663-667.
[5] Cuffey K M, Paterson W S B. The physics of glaciers[M]. 4th ed. USA: Academic Press, 2010.
[6] Paterson W S B. The sliding velocity of Athabasca glacier, Canada[J]. Journal of Glaciology, 1970, 9(55): 55-63.
[7] Nye J F. A comparison between the theoretical and measured long profile of the[J]. 1952, 2(12): 103-107.
[8] Nye J F. The flow of a glacier in a channel of rectangular, elliptic or parabolic cross-section[J]. Journal of Glaciology, 1965, 5(41): 661-690.
[9] Li Huilin, Li Zhongqin, Zhang Mingjun, et al. An improved method based on shallow ice approximation to calculate ice thickness along flow-line and volume of mountain glaciers[J]. Journal of Earth Science, 2011, 22(4): 441-448.
[10] Linsbauer A, Paul F, Haeberli W. Modeling glacier thickness distribution and bed topography over entire mountain ranges with GlabTop: application of a fast and robust approach[J]. Journal of Geophysical Research: Earth Surface, 2012, 117(F3).
[11] Huss M, Farinotti D. Distributed ice thickness and volume of all glaciers around the globe[J]. Journal of Geophysical Research: Earth Surface, 2012, 117(F4).
[12] Vaughan D G, Comiso J C, Allison I, et al. Observations: cryosphere[J]. Climate Change, 2013, 2103: 317-382.
[13] Tapley B D, Bettadpur S, Watkins M, et al. The gravity recovery and climate experiment: mission overview and early results[J]. Geophysical Research Letters, 2004, 31(9): 1-4.
[14] Chen J L, Wilson C R, Tapley B D. Satellite gravity measurements confirm accelerated melting of Greenland ice sheet[J]. Science, 2006, 313(5795): 1958-1960.
[15] Matsuo K, Heki K. Time-variable ice loss in Asian high mountains from satellite gravimetry[J]. Earth and Planetary Science Letters, 2010, 290(1): 30-36.
[16] Stern W. Uber Grundlagen, methodik und bisherige ergebnisse elektrodynamischer dickenmessung von Gletschereis[J]. Z. Gletscherkunde, 1930, 15: 24-42.
[17] Robin G Q, Evans S, Bailey J T. Interpretation of radio echo sounding in polar ice sheets[J]. Philosophical Transactions of the Royal Society of London A: Mathematical, Physical and Engineering Sciences, 1969, 265(1166): 437-505.
[18] Bogorodsky V V, Bentley C R, Gudmandsen P E. Radioglaciology[M]. New York: Springer Science & Business Media, 2012.
[19] Welch B C, Jacobel R W. Analysis of deep-penetrating radar surveys of West Antarctica, US‐ITASE 2001[J]. Geophysical Research Letters, 2003, 30(8): 1444.
[20] Plewes L A, Hubbard B. A review of the use of radio-echo sounding in glaciology[J]. Progress in Physical Geography, 2001, 25(2): 203-236.
[21] Hubbard B, Glasser N F. Field techniques in glaciology and glacial geomorphology[M]. England: John Wiley & Sons, 2005.
[22] Irvine Fynn T D L, Moorman B J, Williams J L M, et al. Seasonal changes in ground-penetrating radar signature observed at a polythermal glacier, Bylot Island, Canada[J]. Earth Surface Processes and Landforms, 2006, 31(7): 892-909.
[23] Pan Yao, Dou Yingke, Guo Jingxue, et al. Isochronous layer extraction of ice sheet based on shallow ice radar, East Antarctic Inland[J]. Journal of Glaciology and Geocryology, 2017, 39(2): 252-258. [潘曜, 窦银科, 郭井学, 等. 基于浅层探冰雷达的东南极内陆地区冰盖内部等时层提取[J]. 冰川冻土, 2017, 39(2): 252-258.]
[24] Zhu Guocai, Qian Songlin, Shen Ying, et al. Type B-1 experimental radar installation for measuring the thickness of glacier[J]. Journal of Glaciology and Geocryology, 1982, 4(2): 93-95. [朱国才, 钱嵩林, 沈颖, 等. B-1型冰川测厚雷达试验装置[J]. 冰川冻土, 1982, 4(2): 93-95.]
[25] Huang Yizhi, Guo Zhongwei, Wan Tianqi, et al. Experiment on radio-echo sounding of a mountain glacier[J]. Journal of Glaciology and Geocryology, 1980, 2(3): 37-40. [黄以职, 顾钟炜, 万天祺, 等. 高山冰川雷达探测试验[J]. 冰川冻土, 1980, 2(3): 37-40.]
[26] He Maobing, Yang Yaxin, Chen Yue, et al. The normal application of GPR to glaciology[J]. Journal of East China Geological institute, 2003, 26(1): 48-51. [何茂兵, 杨亚新, 陈越, 等. 浅谈探地雷达在冰川研究中的应用[J]. 华东地质学院学报, 2003, 26(1): 48-51.]
[27] Wang Puyu, Li Zhongqin, Wu Lihua, et al. Application of ground penetrating radar to the survey of glacier thickness and bedrock topography[J]. Journal Jilin University (Earth Science Edition), 2011(Suppl 1): 393-400. [王璞玉, 李忠勤, 吴利华, 等. 探地雷达在冰川厚度及冰下地形探测中的应用[J]. 吉林大学学报(地球科学版), 2011(增刊1): 393-400.]
[28] Shi Yafeng, Liu Shiyin, Ye Baisheng, et al. Concise glacier inventory of China[M]. Shanghai: Shanghai Popular Science Press, 2008.
[29] Guo Wanqin, Liu Shiyin, Xu Junli, et al. The second Chinese glacier inventory: data, methods and results[J]. Journal of Glaciology, 2015, 61(226): 357-372.
[30] Zhang Xiangsong, Zhu Guocai, Qian Songlin, et al. Radar measuring ice thickness of No.1 Glacier at Ürümqi River, Tianshan[J]. Journal of Glaciology and Geocryology, 1985, 7(2): 153-162. [张祥松, 朱国才, 钱嵩林, 等. 天山乌鲁木齐河源1号冰川雷达测厚[J]. 冰川冻土, 1985, 7(2): 153-162.]
[31] Sun Bo, He Maobing, Zhang Peng, et al. Determination of ice thickness, subice topography and ice volume at Glacier No.1 in Tien Shan, China, by ground penetrating radar[J]. Chinese Journal of Polar Research, 2003, 15(1): 35-44. [孙波, 何茂兵, 张鹏, 等. 天山1号冰川厚度和冰下地形探测与冰储量分析[J]. 极地研究, 2003, 15(1): 35-44.]
[32] Wang Puyu, Li Zhongqin, Li Huilin, et al. Recent evolution in extent, thickness, and velocity of Haxilegen Glacier No. 51, Kuytun River Basin, Eastern Tianshan Mountains[J]. Arctic, Antarctic, and Alpine Research, 2016, 48(2): 241-252.
[33] Ma Linglong, Tian Lide, Pu Jianchen, et al. Recent area and ice volume change of Kangwure Glacier in the middle of Himalayas[J]. Chinese Science Bulletin, 2010, 55(20): 2088-2096.
[34] Zhang Tong, Xiao Cunde, Qin Xiang, et al. Ice thickness observation and landform study of east Rongbuk Glacier, Mt. Qomolangma[J]. Journal of Glaciology and Geocryology, 2012, 34(5): 1059-1066. [张通, 效存德, 秦翔, 等. 珠穆朗玛峰东绒布冰川厚度测量与地形特征分析[J]. 冰川冻土, 2012, 34(5): 1059-1066.]
[35] Zhu Meilin, Yao Tandong, Yang Wei, et al. Ice volume and characteristics of subglacial topography of the Zhadang Glacier, Nyainqêntanglha Range[J]. Journal of Glaciology and Geocryology, 2014, 36(2): 268-277. [朱美林, 姚檀栋, 杨威, 等. 念青唐古拉山扎当冰川冰储量估算及冰下地形特征分析[J]. 冰川冻土, 2014, 36(2): 268-277.]
[36] Zhu Dayun, Tian Lide, Wang Jianli, et al. The Qiangtang Glacier No.1 in the middle of the Tibetan Plateau; depth sounded by using GPR and volume eatimated[J]. Journal of Glaciology and Geocryology, 2014, 36(2): 278-285. [朱大运, 田立德, 王建力, 等. 青藏高原中部双湖羌塘1号冰川厚度特征及冰储量估算[J]. 冰川冻土, 2014, 36(2): 278-285.]
[37] Ma Linglong, Tian Lide, Yang Wei, et al. Measuring the depth of Gurenhekou glacier in the south of the Tibetan Plateau using GPR and estimating its volume based on the outcomes[J]. Journal of Glaciology and Geocryology, 2008, 30(5): 783-788. [马凌龙, 田立德, 杨威, 等. 青藏高原南部羊八井古仁河口冰川GPR测厚及冰川体积估算[J]. 冰川冻土, 2008, 30(5): 783-788.]
[38] Wang Yuzhe, Ren Jiawen, Qin Xiang, et al. Ice depth and glacier-bed characteristics of the Laohugou Glacier No.12, Qilian Mountains, revealed by ground-penetrating radar[J]. Journal of Glaciology and Geocryology, 2016, 38(1): 28-35. [王玉哲, 任贾文, 秦翔, 等. 祁连山老虎沟12号冰川雷达测厚和冰下地形特征研究[J]. 冰川冻土, 2016, 38(1): 28-35.]
[39] Wang Puyu, Li Zhongqin, Wang Wenbin, et al. Glacier volume calculation from ice-thickness data for mountain glaciers: a case study of Glacier No.4 of Sigong River over Mt. Bogda, eastern Tianshan, Central Asia[J]. Journal of Earth Science, 2014, 25(2): 371-378.
[40] Pu Jianchen, Yao Tandong. The mass balance research of Meikuang Glacier, Xidatan[M]//Yao Tandong, Yutaka Ageta. Tibetan Plateau glacier climate and environment. Beijing: Science Press, 1993: 69-73. [蒲健辰, 姚檀栋. 西大滩煤矿冰川的物质平衡观测研究[M]//姚檀栋, 上田丰. 青藏高原冰川气候与环境. 北京: 科学出版社, 1993: 69-73.]
[41] Pu Jianchen, Yao Tandong, Zhang Yinsheng, et al. Mass balance on the dongkemadi and Meikuang Glaciers in 1992/1993[J]. Journal of Glaciology and Geocryology, 1995, 17(2): 138-143. [蒲健辰, 姚檀栋, 张寅生, 等. 冬克玛底冰川和煤矿冰川的物质平衡(1992/1993 年)[J]. 冰川冻土, 1995, 17(2): 138-143.]
[42] Yao Tandong, Wang Youqing, Liu Shiyin, et al. Recent glacial retreat in high Asia in China and its impact on water resource in Northwest China[J]. Science in China: Series D Earth Sciences, 2004, 47(12): 1065-1075.
[43] Wu Kunpeng, Liu Shiyin, Bao Weijia, et al. Remote sensing monitoring of the glacier change in the Gangrigabu Range, southeast Tibetan Plateau from 1980 through 2015[J]. Journal of Glaciology and Geocryology, 2017, 39(1): 24-34. [吴坤鹏, 刘时银, 鲍伟佳, 等. 1980-2015年青藏高原东南部岗日嘎布山冰川变化的遥感监测[J]. 冰川冻土, 2017, 39(1): 24-34.]
[44] Ye Wanhua, Wang Feiteng, Li Zhongqin, et al. Temporal and spatial distributions of the equilibrium line altitudes of the monitoring glaciers in high Asia[J]. Journal of Glaciology and Geocryology, 2016, 38(6): 1459-1469. [叶万花, 王飞腾, 李忠勤, 等. 高亚洲定位监测冰川平衡线高度时空分布特征研究[J]. 冰川冻土, 2016, 38(6): 1459-1469.]
[45] Cressie N. Spatial prediction and ordinary kriging[J]. Mathematical Geology, 1988, 20(4): 405-421.
[46] MacGregor K R, Anderson R S, Anderson S P, et al. Numerical simulations of glacial-valley longitudinal profile evolution[J]. Geology, 2000, 28(11): 1031-1034.
[47] Svensson H. Is the cross-section of a glacial valley a parabola?[J]. Journal of Glaciology, 1959, 3(25): 362-363.
[48] Harbor J M. Numerical modeling of the development of U-shaped valleys by glacial erosion[J]. Geological Society of America Bulletin, 1992, 104(10): 1364-1375.
[49] Graf W L. The geomorphology of the glacial valley cross section[J]. Arctic and Alpine Research, 1970: 303-312.
[50] Hirano M, Aniya M. A rational explanation of cross-profile morphology for glacial valleys and of glacial valley development[J]. Earth Surface Processes and Landforms, 1988, 13(8): 707-716.
[51] Li Yingku, Liu Gengnian. Discussion on the cross section features of glacial valley[J]. Journal of Glaciology and Geocryology, 2000, 22(2): 171-177. [李英奎, 刘耕年. 冰川槽谷横剖面形态特征探析[J]. 冰川冻土, 2000, 22(2): 171-177.]
[52] Liu Shiyin, Yao Xiaojun, Guo Wanqin, et al. The contemporary glaciers in China based on the Second Chinese Glacier Inventory[J]. Acta Geographica Sinica, 2015, 70(1): 3-16. [刘时银, 姚晓军, 郭万钦, 等. 基于第二次冰川编目的中国冰川现状[J]. 地理学报, 2015, 70(1): 3-16.]
[53] Radi V, Hock R. Regional and global volumes of glaciers derived from statistical upscaling of glacier inventory data[J]. Journal of Geophysical Research: Earth Surface, 2010, 115: F01010.
[54] Bahr D B, Meier M F, Peckham S D. The physical basis of glacier volume-area scaling[J]. Journal of Geophysical Research: Solid Earth, 1997, 102(B9): 20355-20362.
[55] Liu Shiyin, Shen Wenxin, Shen Yongping, et al. Glacier changes since the Little Ice Age maximum in the western Qilian Shan, northwest China, and consequences of glacier runoff for water supply[J]. Journal of Glaciology, 2003, 49(164): 117-124.
Ice thickness sounded by ground penetrating radar on theMeikuang Glacier in the Eastern Kunlun Mountains
Abstract: Glacier is an important surface water resources in Northwest China. However, due to lack of measured glacier ice thickness data, the ice reserve estimation of glacier has varying degree of indeterminacy. In May of 2015, ice thickness of the Meikuang Glacier on the Eastern Kunlun Mountains was sounded by a pulse EKKO PRO Ground Penetrating Radar system (with a 100 MHz antenna), with five short transversal profiles and one long longitudinal profile. Based on the GPR data, GPS position of the sounding point, SRTM DEM data (30 meters) and Landsat8 OLI image in 2015, the Meikuang Glacier was seperated a sounded area from the whole glacier field. Ice thickness contour map was drawn by Ordinary Kriging method and ice reserve was calculated by integration of thickness and boundary distribution data under the support of GIS technology. The sounding showed that the maximum thickness was 87 meters at 4 952 meters elevation, near to the main flow line. It was found that in 2015 the glacierized area, average thickness and total ice reserve of the glacier was 0.95 km2, 25.77 meters and 0.0242 km3, respectively. Based on raster map of the glacier surface and ice thickness, the topography of glacier bed was obtained. The results show that the glacier is wide in the upper part and narrow along the valley, and the glacier bed is complex. In the area with larger thickness, the topography has near V-shape, showing the morphological characteristics of cirque glacier.
Key words: ground penetrating radar (GPR); Meikuang Glacier; Eastern Kunlun Mountains; ice thickness; ice volume
(本文编辑: 周成林)
DOI:10.7522/j.issn.1000-0240.2017.0320
LI Yanan, LI Zhen, WANG Ninglian. Ice thickness sounded by ground penetrating radar on the Meikuang Glacier in the Eastern Kunlun Mountains[J]. Journal of Glaciology and Geocryology, 2018, 40(1): 38-46. [李亚楠, 李真, 王宁练. 东昆仑山煤矿冰川雷达测厚及冰储量估算[J]. 冰川冻土, 2018, 40(1): 38-46.]
收稿日期: 2017-08-29;
修订日期:2017-11-12
基金项目: 中国西部主要冰川作用中心冰量变化调查项目(2013FY111400); 国家自然科学基金项目(41190084; 41501069); 冰冻圈科学国家重点实验室开放基金项目(SKLCS-OP-2017-10)资助
中图分类号: P343.6/P631.3
文献标志码:A
文章编号:1000-0240(2018)01-0038-09
