青藏高原东南部冰川雪冰重金属元素特征
【类型】期刊
【作者】刘亚军,张玉兰,康世昌,李小飞,陈鹏飞,郭军明(中国科学院西北生态环境资源研究院冰冻圈科学国家重点实验室;中国科学院青藏高原地球科学卓越创新中心)
【作者单位】中国科学院西北生态环境资源研究院冰冻圈科学国家重点实验室;中国科学院青藏高原地球科学卓越创新中心
【刊名】冰川冻土
【关键词】 重金属元素;冰川;雪冰样品;人类活动;青藏高原
【资助项】国家自然科学基金项目(41671067,41630754,41721091);冰冻圈科学国家重点实验室自主项目(SKLCS-ZZ-2017);中国科学院西北生态环境资源研究院青年基金项目...
【ISSN号】1000-0240
【页码】P1200-1211
【年份】2019
【期号】第6期
【期刊卷】1;|7;|8;|2
【摘要】雪冰可以很好地记录大气重金属元素的含量水平。基于2015年6月在青藏高原东南部(藏东南)地区采集的4条冰川的雪坑和表层雪冰样品,分析并讨论了雪冰重金属元素特征。结果显示,Pb、Cd等重金属元素含量与高原其他地区雪冰中一致,含量总体较低,显著低于天山和阿尔卑斯山雪冰中Pb和Cd含量,与格陵兰地区雪冰Pb和Cd含量大致相当,但显著高于南极地区雪冰中Pb和Cd含量,这表明藏东南雪冰中元素含量仍代表全球背景地区大气环境状况。元素富集因子结果显示,Pb、Cr、Cd、Cu、Zn、Mo、Sn等发生强烈富集(EFs>10),而以地壳源为主的元素如Fe、Ti、Mn、Th等则富集较弱。主成分分析表明,不同重金属元素的污染来源存在差异;结合后向气团轨迹分析,推断藏东南地区雪冰元素含量不可避免地受到南亚地区人类活动排放污染物的显著影响。目前,藏东南地区冰川呈显著退缩状态,强烈的冰川消融可释放大量的重金属元素进入河流,可能对下游地区的人类生产生活以及生态系统产生重要影响。
【全文】 文献传递
青藏高原东南部冰川雪冰重金属元素特征
摘 要: 雪冰可以很好地记录大气重金属元素的含量水平。基于2015年6月在青藏高原东南部(藏东南)地区采集的4条冰川的雪坑和表层雪冰样品, 分析并讨论了雪冰重金属元素特征。结果显示, Pb、 Cd等重金属元素含量与高原其他地区雪冰中一致, 含量总体较低, 显著低于天山和阿尔卑斯山雪冰中Pb和Cd含量, 与格陵兰地区雪冰Pb和Cd含量大致相当, 但显著高于南极地区雪冰中Pb和Cd含量, 这表明藏东南雪冰中元素含量仍代表全球背景地区大气环境状况。元素富集因子结果显示, Pb、 Cr、 Cd、 Cu、 Zn、 Mo、 Sn等发生强烈富集(EFs>10), 而以地壳源为主的元素如Fe、 Ti、 Mn、 Th等则富集较弱。主成分分析表明, 不同重金属元素的污染来源存在差异; 结合后向气团轨迹分析, 推断藏东南地区雪冰元素含量不可避免地受到南亚地区人类活动排放污染物的显著影响。目前, 藏东南地区冰川呈显著退缩状态, 强烈的冰川消融可释放大量的重金属元素进入河流, 可能对下游地区的人类生产生活以及生态系统产生重要影响。
关键词: 重金属元素; 冰川; 雪冰样品; 人类活动; 青藏高原
0 引言
有毒重金属元素(如Pb和Hg等)的排放以及长距离传输对全球生态环境和人类健康具有潜在威胁, 特别是19世纪中叶工业革命以来, 人类活动释放的重金属污染物等对大气环境的影响备受关注[1-2]。自然环境较为纯净的偏远地区是气候变化和大气污染物的“敏感指示器”, 有毒重金属污染物等的赋存能够显著影响区域的环境状况和生态系统[2-5]。由于重金属元素在自然界的本底值很低, 其污染程度大多与工业、 采矿、 冶金等密切相关, 因此可以作为评价人类活动对大气环境影响的良好代用指标[6-7]。
重金属元素主要包括Pb、 Hg、 Sb、 Cr、 Cd、 Co、 Ni、 Cu、 Zn、 Sn等, 以及类金属元素As及其化合物。雪冰作为气候环境变化信息的载体, 可以很好地记录大气重金属元素的含量水平和历史变化[8-11]。对南极冰芯的研究表明, 该区域20世纪20年代初期已经受到人类活动排放的Pb污染[12]。格陵兰冰芯中Pb记录到罗马时期含量(3 pg·g-1)较自然本底(0.5 pg·g-1)显著偏高; 工业革命以来急剧升高, 在20世纪60年代中期达到最大值(约240 pg·g-1), 20世纪80年代开始逐渐下降, 这些变化主要受北半球的工业污染影响[13]。欧洲阿尔卑斯山地区, 冰芯重金属元素记录显示20世纪50年代以来含量较17和18世纪显著上升, 特别是Cd和Bi等富集数十倍, 表明欧洲地区大气重金属污染对雪冰记录具有重要影响[9-10]; Colle Gnifetti冰芯记录的Pb含量在20世纪70年代中期达到峰值, 约为3 ng·g-1, 富集因子可达300[14]。上述研究表明, 金属污染物经大气等介质可传输到偏远地区雪冰中, 显著影响其在雪冰中的含量水平。
以青藏高原为主体的我国西部冰冻圈, 广泛发育有大量现代冰川, 是除南北极外冰川分布最广的区域[15]。目前, 在高原南部的珠穆朗玛峰地区[7,11,16]、 高原中部的唐古拉山脉地区[17]和玉珠峰地区[18]、 高原西北部慕士塔格峰地区[19]及其毗邻的天山地区等[20], 均有报道雪冰中的元素含量特征。总体上, 青藏高原北部地区雪冰中重金属元素含量较南部显著偏高[21]。东天山庙尔沟冰芯和珠峰东绒布冰芯均显示, 重金属元素含量自工业革命以来逐渐上升, 特别是20世纪50年代以来增加趋势更为明显[7,20]。这些结果说明, 青藏高原地区已经受到人类活动排放的重金属污染物的影响。
亚洲区域被认为是释放大气重金属污染物的主要区域, 认识大气中金属污染物对青藏高原雪冰记录的影响具有重要意义。已有研究认为, 南亚大气污染物可以翻越喜马拉雅山脉, 甚至影响高原腹地(如纳木错)[22-23]。而在青藏高原东南部深受印度季风影响的地区, 仍缺乏雪冰重金属元素记录的研究。与此同时, 过去几十年来, 气候变化导致青藏高原80%的冰川发生退缩, 藏东南地区冰川消融最为剧烈[24]。冰川消融释放的重金属元素进入河流, 可能对下游地区的人类生产生活以及生态系统产生重要影响[21]。因此, 本文选取青藏高原东南部典型冰川采集雪坑以及表层雪冰样品(见图1), 测试主要的重金属元素Pb、 Cr、 Cd等, 通过分析揭示上述元素的含量与富集因子变化, 探讨青藏高原东南部雪冰中重金属元素的自然源和人为源, 提升对该地区大气重金属污染现状的认识。本研究将进一步丰富青藏高原雪冰重金属元素数据库, 为评估人类活动对青藏高原大气环境的污染提供科学基础。
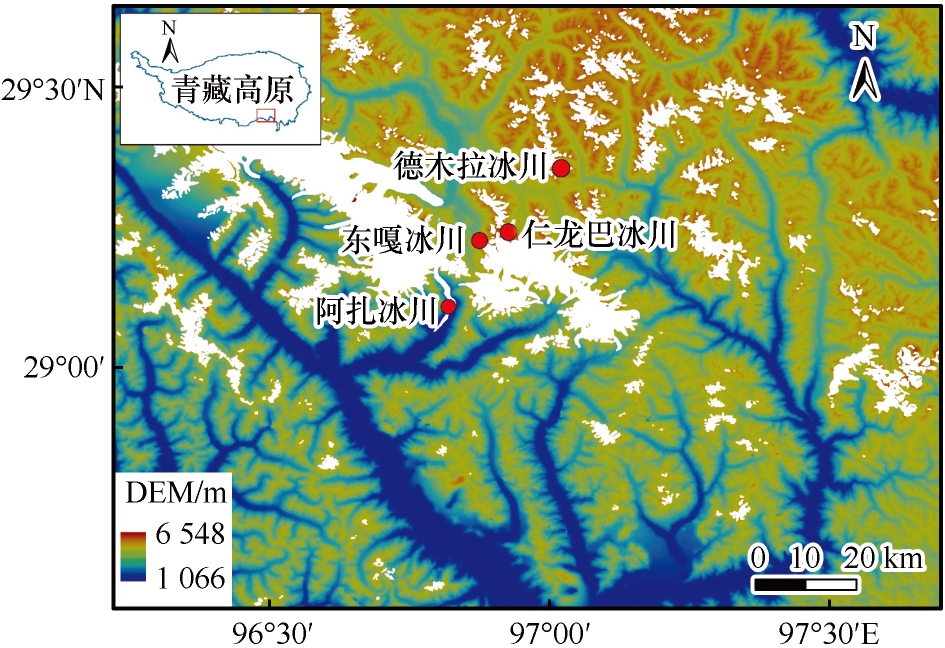
图1 藏东南地区雪坑和表层雪冰采样点位置
Fig.1 Map showing the locations of sampling sitesin the southeastern Tibetan Plateau
1 材料与方法
1.1 研究区概况
青藏高原平均海拔超过4 000 m, 面积达250万km2, 是全球海拔最高的一个独特的地理单元, 被誉为“第三极”[15]。青藏高原发育有大量现代冰川, 其冰川融水成为亚洲许多大江大河的发源地, 如长江、 黄河、 雅鲁藏布江、 恒河和印度河等, 因而也被称为“亚洲水塔”[25]。青藏高原夏半年受印度洋季风的影响显著, 冬半年则主要受控于西风急流[26]。高原的温度和水分条件具有自西北向东南变化的特征, 高原的西北部比较严寒干燥, 东南部比较温暖湿润[27]。过去40年来, 青藏高原升温显著, 降水变化存在区域差异[28-29]。藏东南夏半年主要受印度季风的影响, 年均降水可达800~1 000 mm, 年均气温为5.6 ℃[30-31]。因地处印度洋季风向青藏高原输送冷空气的主要通道, 降水充沛, 有利于冰川的发育, 是我国海洋型冰川的主要分布区, 约占我国冰川总条数的20%。目前, 藏东南地区冰川呈显著退缩状态, 冰川末端退缩速率可达-48 m·a-1, 冰川面积由20世纪70年代的217.9 km2减少至21世纪00年代的174.6 km2, 每年减少率为-0.903%, 冰川物质平衡约为-1 100 mm[24,32-33]。
东嘎冰川位于西藏昌都市八宿县然乌镇境内, 紧邻然乌湖, 是来古冰川群的一条西北朝向冰川。来古冰川群是帕隆藏布的源头, 冰雪融水流进了然乌湖。仁龙巴冰川位于八宿县然乌镇和察隅县交界处的“日隆巴”地区, 冰舌末端海拔4 560 m, 朝向南, 为典型的海洋性山谷冰川。德木拉冰川(帕隆藏布390号冰川)表面被零星的表碛覆盖, 冰川末端海拔为4 600 m以上。对于面积较小且海拔较低的冰川, 如德木拉冰川, 平衡线高度已超出冰川表面最高点, 冰川净消融量远远大于净积累量。因此, 这些冰川显示出较大的负物质平衡[24,32-33]。阿扎冰川位于察隅县上察隅镇境内, 朝向西南, 长度为20 km, 主峰高6 882 m, 冰川末端海拔约2 500 m, 是目前西藏海拔最低的冰川, 冰川下游分布在森林之中, 形成世界上极为罕见的森林、 冰川景观。
1.2 采样方法和实验分析
2015年6月, 在藏东南的东嘎冰川、 仁龙巴冰川、 德木拉冰川等3条冰川分别采集了雪坑和表层雪冰样品; 在阿扎冰川采集了表层雪冰样品(图1和表1)。其中, 东嘎冰川、 仁龙巴冰川、 德木拉冰川采样当天均有降雪事件发生; 在阿扎冰川采样时, 冰川表面没有积雪, 为附加冰面。
表1 藏东南地区东嘎、 仁龙巴、 德木拉和阿扎冰川雪冰样品采样点信息
Table 1 Information of the snowpit and surface snow/ice collected from Dongga, Renlongba, Demula, and Azha Glaciers in the southeastern Tibetan Plateau
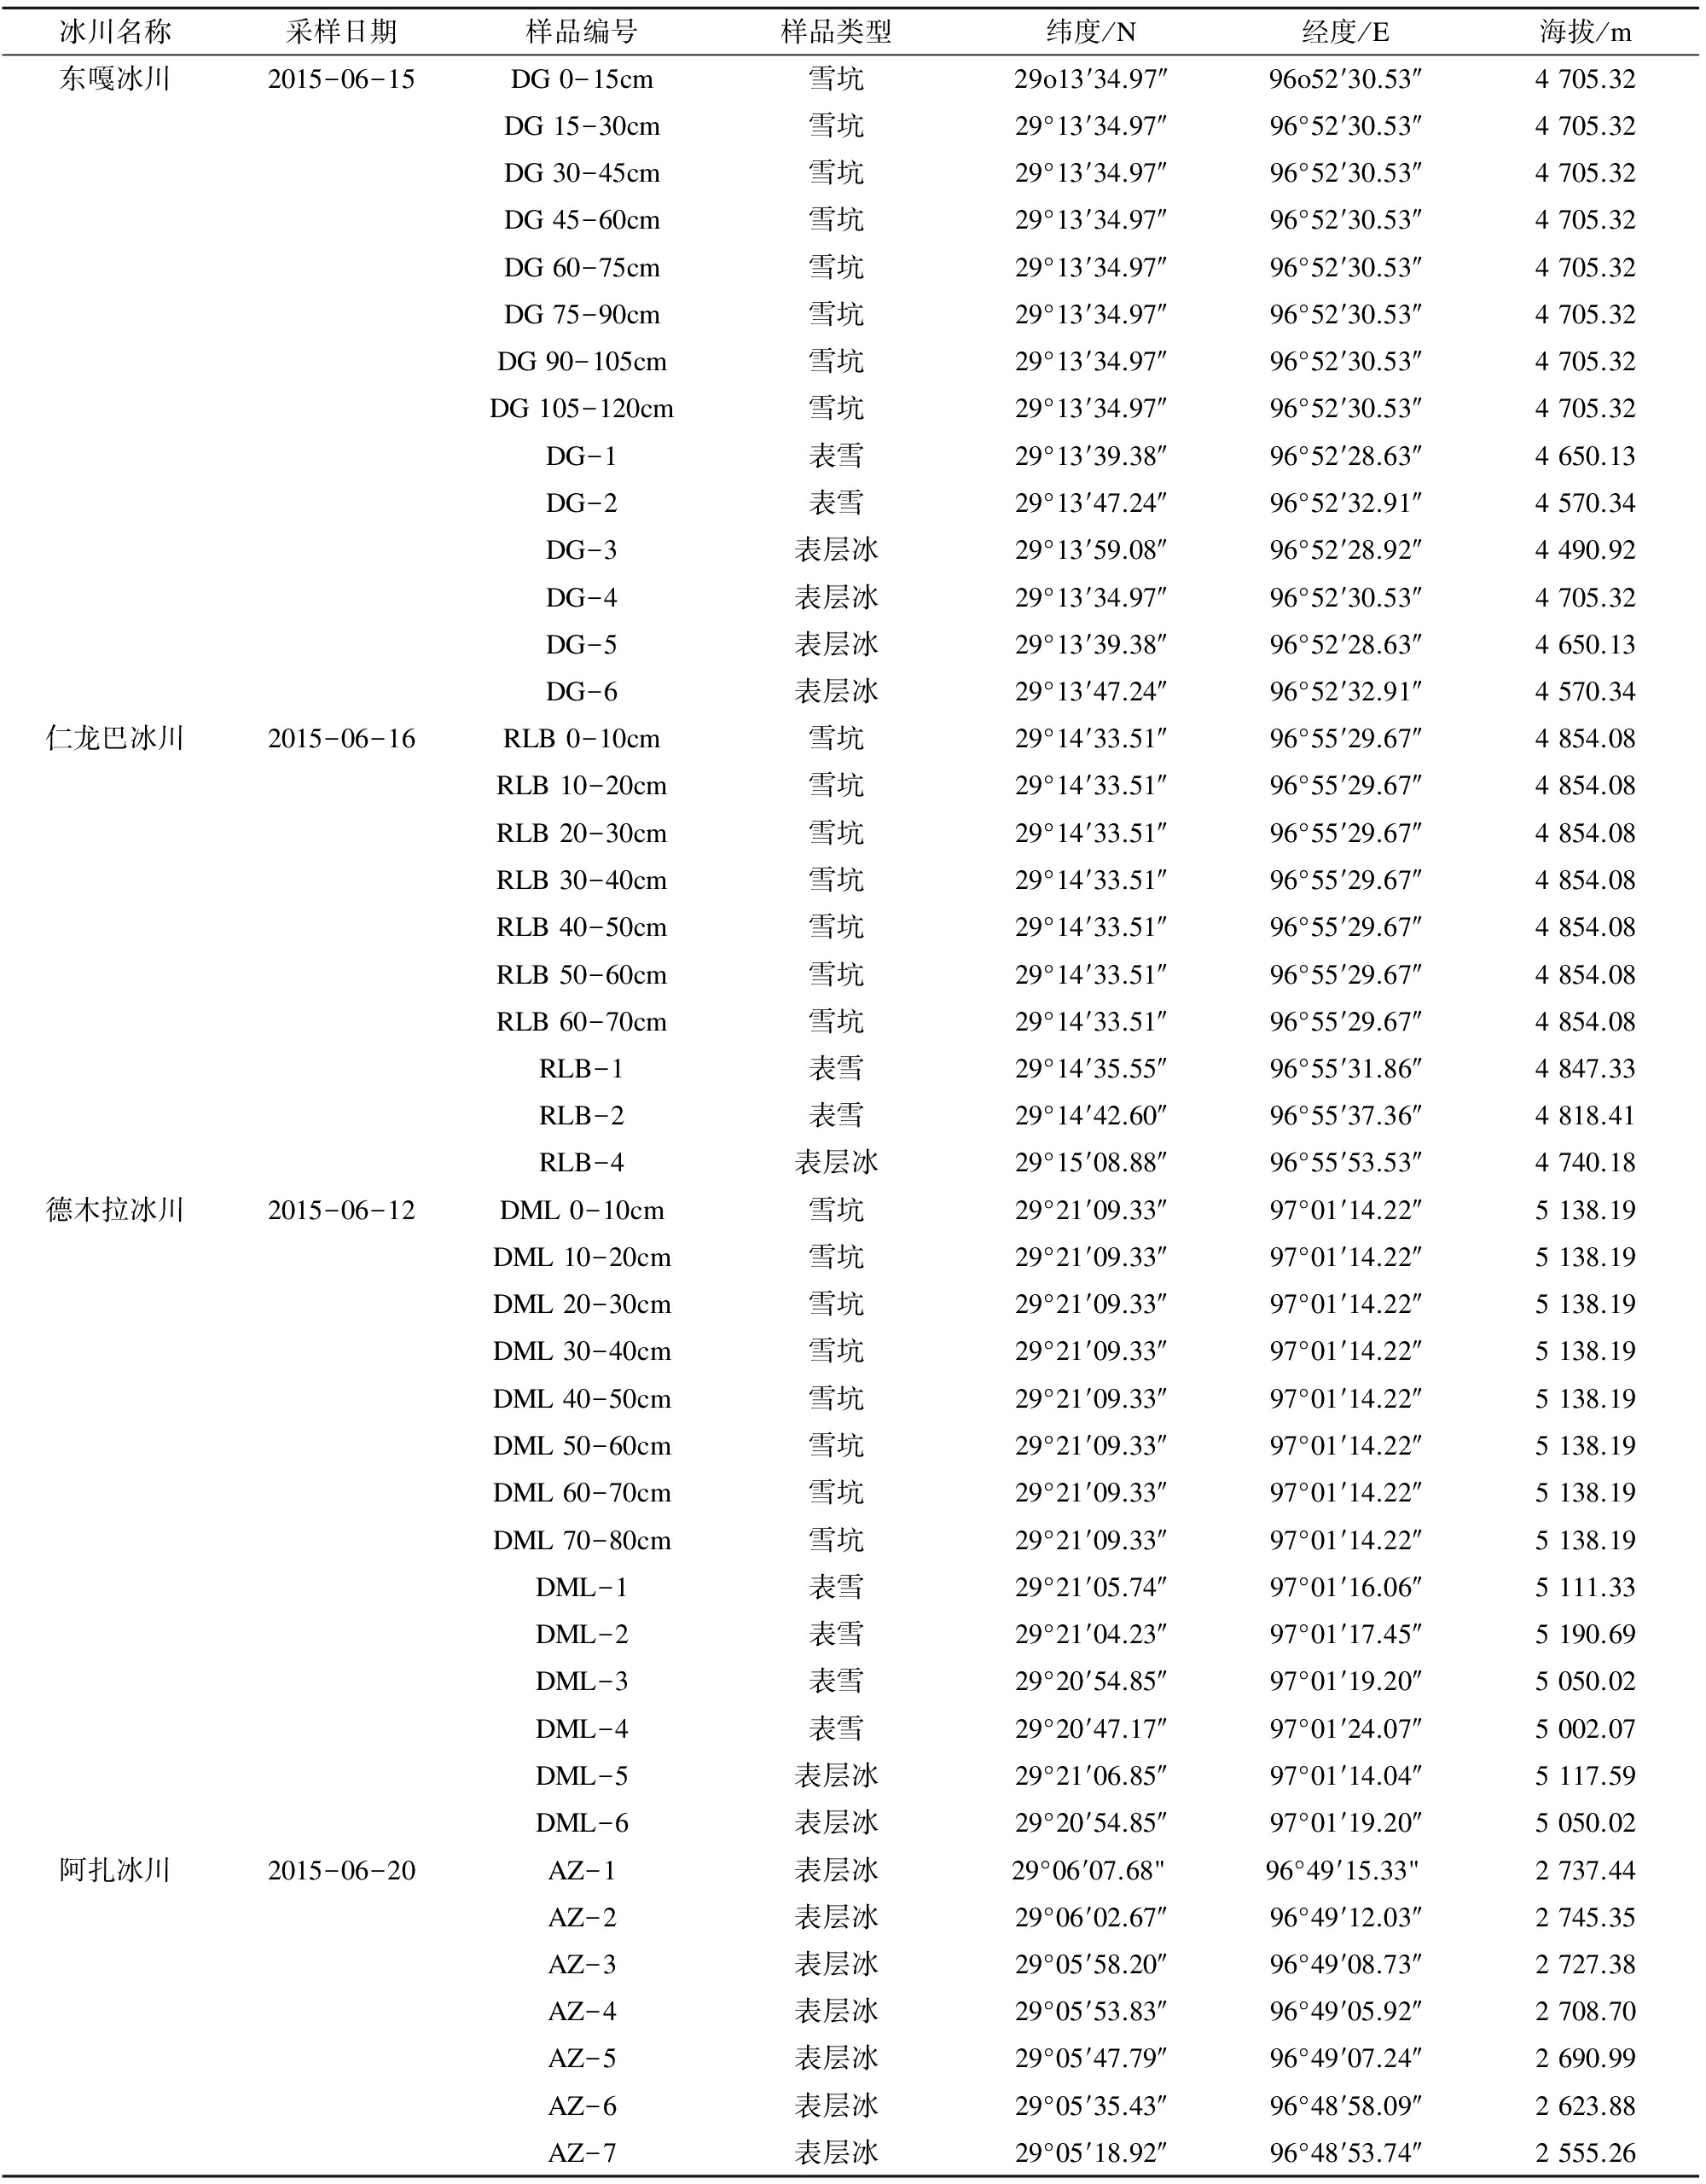
冰川名称采样日期样品编号样品类型纬度/N经度/E海拔/m东嘎冰川2015-06-15DG0-15cm雪坑29o13′34.97″96o52′30.53″4705.32DG15-30cm雪坑29°13′34.97″96°52′30.53″4705.32DG30-45cm雪坑29°13′34.97″96°52′30.53″4705.32DG45-60cm雪坑29°13′34.97″96°52′30.53″4705.32DG60-75cm雪坑29°13′34.97″96°52′30.53″4705.32DG75-90cm雪坑29°13′34.97″96°52′30.53″4705.32DG90-105cm雪坑29°13′34.97″96°52′30.53″4705.32DG105-120cm雪坑29°13′34.97″96°52′30.53″4705.32DG-1表雪29°13′39.38″96°52′28.63″4650.13DG-2表雪29°13′47.24″96°52′32.91″4570.34DG-3表层冰29°13′59.08″96°52′28.92″4490.92DG-4表层冰29°13′34.97″96°52′30.53″4705.32DG-5表层冰29°13′39.38″96°52′28.63″4650.13DG-6表层冰29°13′47.24″96°52′32.91″4570.34仁龙巴冰川2015-06-16RLB0-10cm雪坑29°14′33.51″96°55′29.67″4854.08RLB10-20cm雪坑29°14′33.51″96°55′29.67″4854.08RLB20-30cm雪坑29°14′33.51″96°55′29.67″4854.08RLB30-40cm雪坑29°14′33.51″96°55′29.67″4854.08RLB40-50cm雪坑29°14′33.51″96°55′29.67″4854.08RLB50-60cm雪坑29°14′33.51″96°55′29.67″4854.08RLB60-70cm雪坑29°14′33.51″96°55′29.67″4854.08RLB-1表雪29°14′35.55″96°55′31.86″4847.33RLB-2表雪29°14′42.60″96°55′37.36″4818.41RLB-4表层冰29°15′08.88″96°55′53.53″4740.18德木拉冰川2015-06-12DML0-10cm雪坑29°21′09.33″97°01′14.22″5138.19DML10-20cm雪坑29°21′09.33″97°01′14.22″5138.19DML20-30cm雪坑29°21′09.33″97°01′14.22″5138.19DML30-40cm雪坑29°21′09.33″97°01′14.22″5138.19DML40-50cm雪坑29°21′09.33″97°01′14.22″5138.19DML50-60cm雪坑29°21′09.33″97°01′14.22″5138.19DML60-70cm雪坑29°21′09.33″97°01′14.22″5138.19DML70-80cm雪坑29°21′09.33″97°01′14.22″5138.19DML-1表雪29°21′05.74″97°01′16.06″5111.33DML-2表雪29°21′04.23″97°01′17.45″5190.69DML-3表雪29°20′54.85″97°01′19.20″5050.02DML-4表雪29°20′47.17″97°01′24.07″5002.07DML-5表层冰29°21′06.85″97°01′14.04″5117.59DML-6表层冰29°20′54.85″97°01′19.20″5050.02阿扎冰川2015-06-20AZ-1表层冰29°06′07.68"96°49′15.33"2737.44AZ-2表层冰29°06′02.67″96°49′12.03″2745.35AZ-3表层冰29°05′58.20″96°49′08.73″2727.38AZ-4表层冰29°05′53.83″96°49′05.92″2708.70AZ-5表层冰29°05′47.79″96°49′07.24″2690.99AZ-6表层冰29°05′35.43″96°48′58.09″2623.88AZ-7表层冰29°05′18.92″96°48′53.74″2555.26
采集雪坑样品时, 先用不锈钢铲子清理雪坑剖面, 以10 cm或15 cm间距自剖面上部向下连续采样, 样品置于洁净的Whirl-Pak塑料袋内。采集冰川表层雪冰样品时, 选取冰川表层分布均匀的5~10 cm深度的样品, 并装入Whirl-Pak塑料袋内。样品经热水浴融化后用已经预处理的石英滤膜进行过滤, 过滤后的液体样品装入洁净的聚乙烯塑料瓶内并在-20 ℃冷库内储存。样品在采集、 存储、 处理过程中, 工作人员均需穿戴洁净服、 洁净口罩以及手套。雪冰样品重金属元素含量在中国科学院青藏高原研究所环境变化与地表过程重点实验室利用电感耦合等离子体质谱仪(ICP-MS)进行测试分析。分析时, 加入1 ng·g-1的铟做内标, 利用标准参考物质(SLRS-4)作为参考, 元素含量及检测限等见表2。详细的测试分析方法见文献[34]。
2 结果与讨论
2.1 雪坑和表层雪/冰中元素含量
东嘎、 仁龙巴、 德木拉和阿扎冰川雪冰中Pb的平均含量分别为 76.07、 117.63、 74.96和 256.28 pg·g-1, Cr含量分别为1.53、 1.99、 0.78和4.40 ng·g-1(表2)。由于阿扎冰川采集的都是表层冰样, Pb、 Cr、 Cd以及其他元素含量均比其余3条冰川偏高(图2), 这可能与阿扎冰川表层雪融化导致元素的相对富集有关。
与其他地区雪冰Pb和Cd记录对比(表3), 发现藏东南地区雪冰中Pb和Cd含量略低于青藏高原中部(如唐古拉小冬克玛底冰川)以及北部(慕士塔格、 古里雅以及祁连山)地区, 这可能与高原中部以及北部地区受粉尘影响较大有关[17]。同时, 也显著低于受人类活动以及粉尘影响较大的天山地区[20]。总体上, 青藏高原地区雪冰中元素含量较低, 反映了偏远地区背景值。
表2 藏东南地区东嘎、 仁龙巴、 德木拉和阿扎冰川雪冰元素含量
Table 2 Some element concentrations in snowpit and surface snow/ice collected from Dongga, Renlongba, Demula, and Azha Glaciers in the southeastern Tibetan Plateau
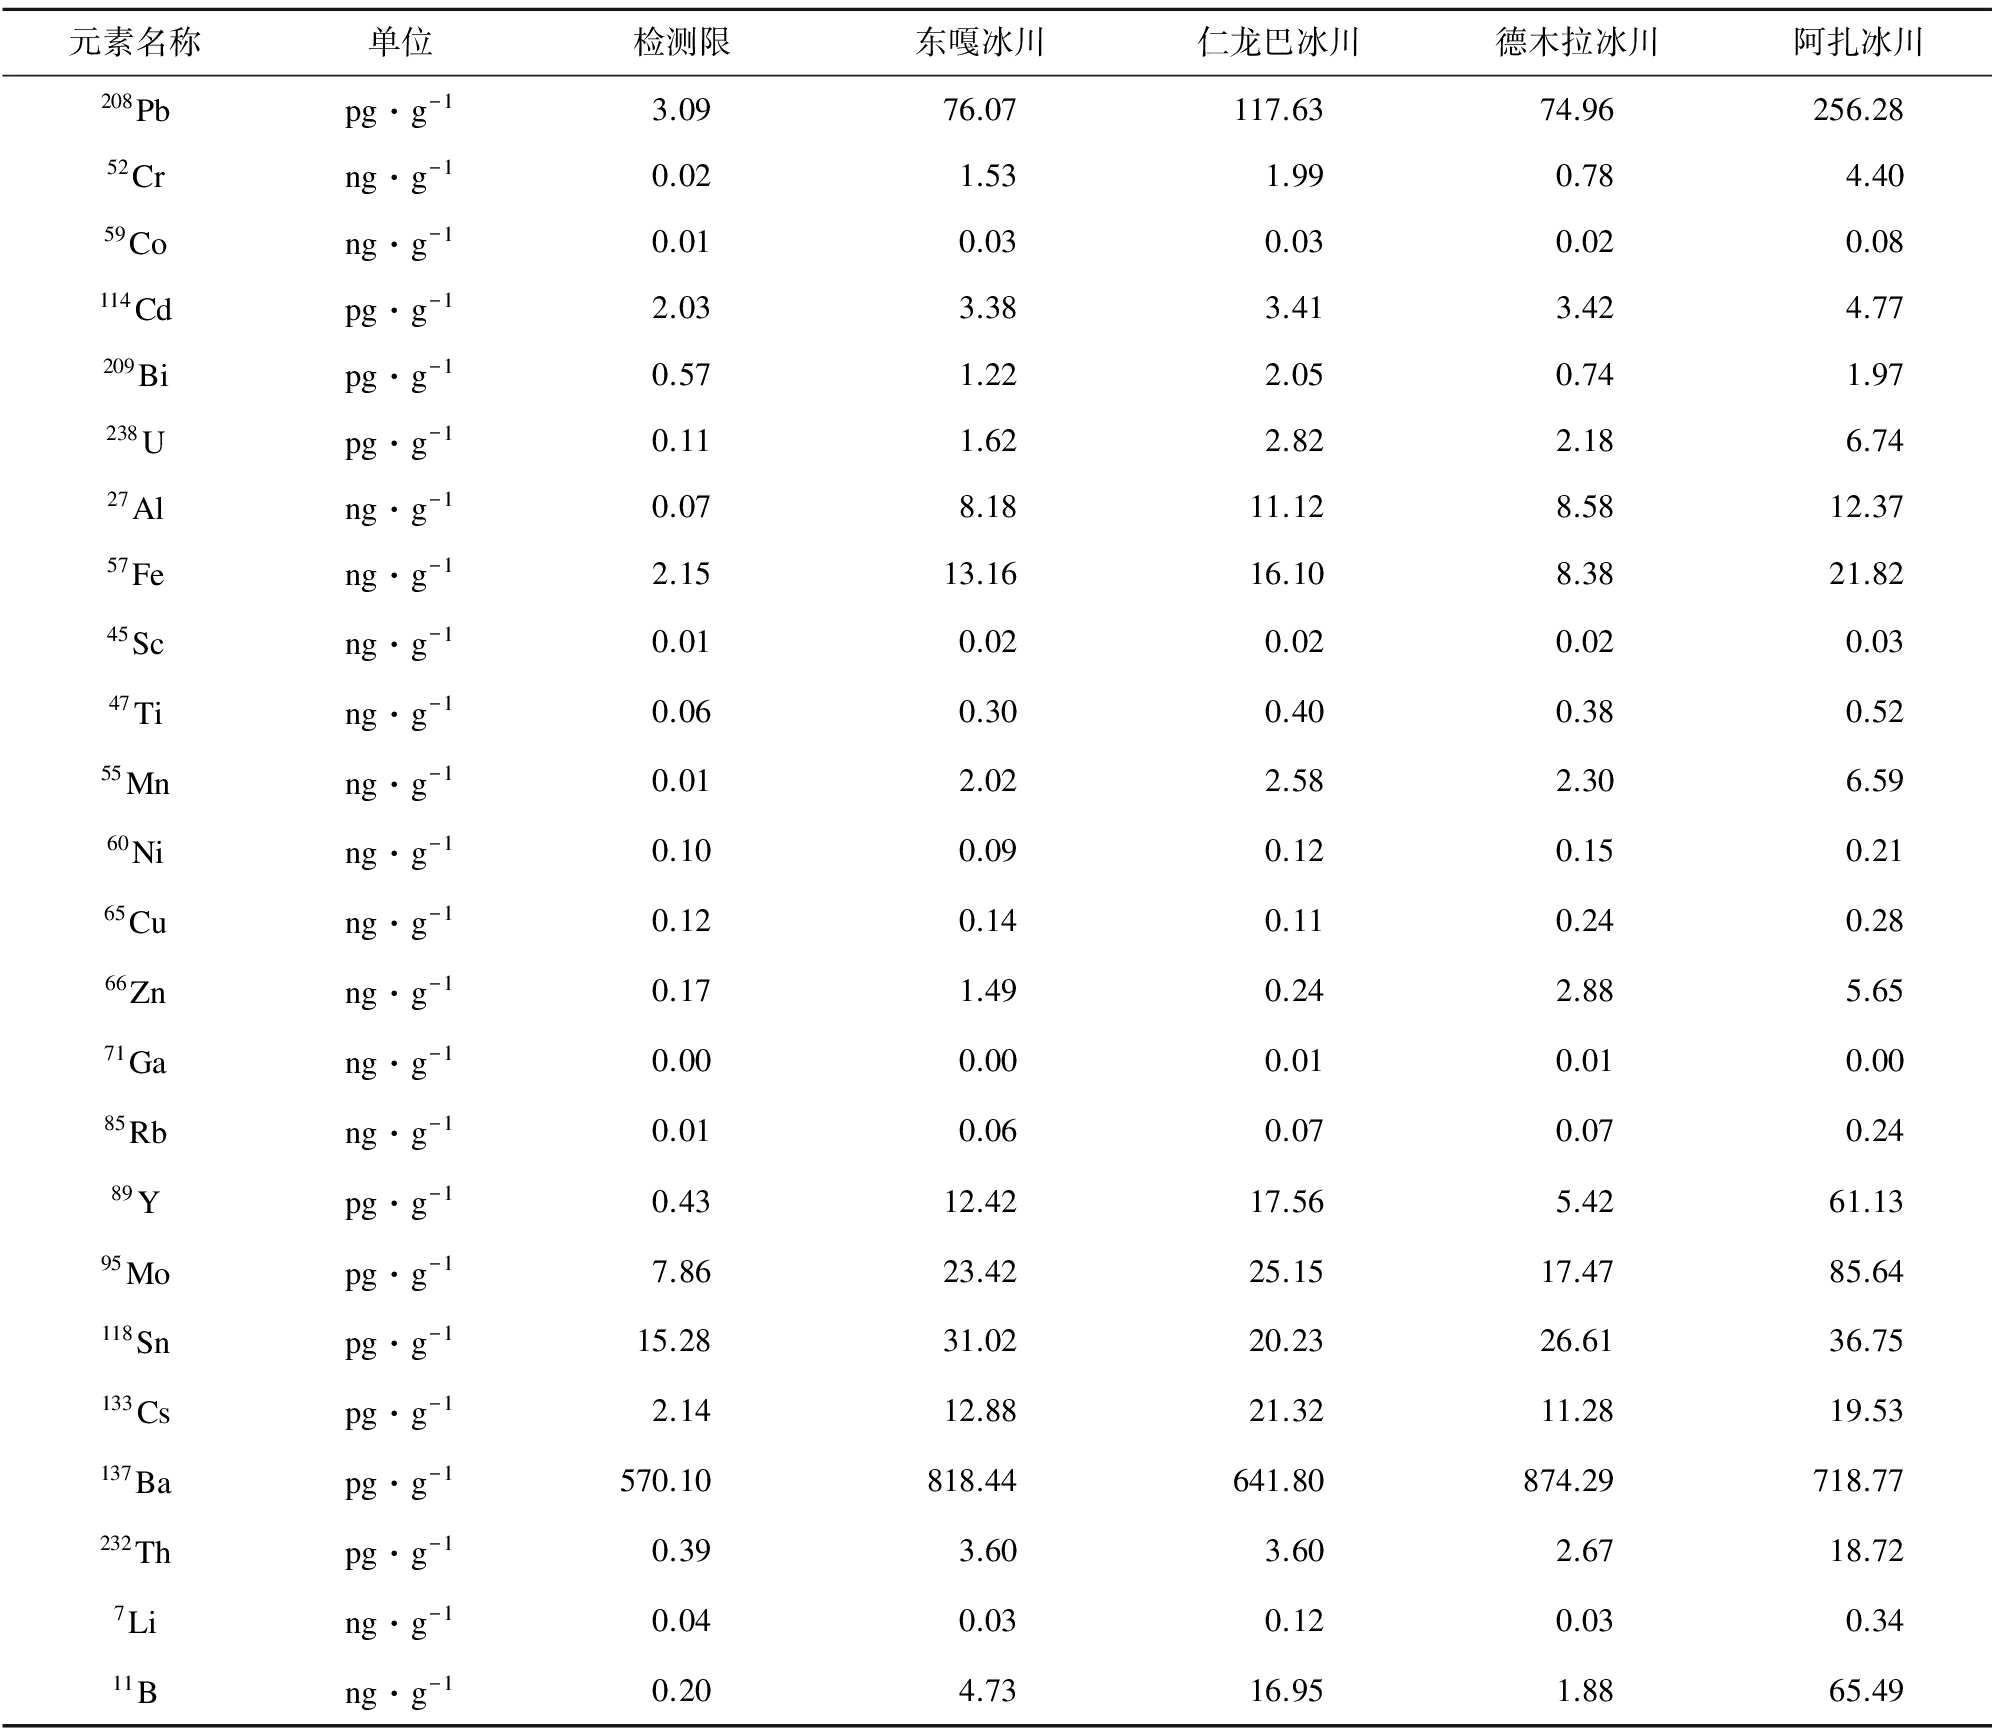
元素名称单位检测限东嘎冰川仁龙巴冰川德木拉冰川阿扎冰川208Pbpg·g-13.0976.07117.6374.96256.2852Crng·g-10.021.531.990.784.4059Cong·g-10.010.030.030.020.08114Cdpg·g-12.033.383.413.424.77209Bipg·g-10.571.222.050.741.97238Upg·g-10.111.622.822.186.7427Alng·g-10.078.1811.128.5812.3757Feng·g-12.1513.1616.108.3821.8245Scng·g-10.010.020.020.020.0347Ting·g-10.060.300.400.380.5255Mnng·g-10.012.022.582.306.5960Ning·g-10.100.090.120.150.2165Cung·g-10.120.140.110.240.2866Znng·g-10.171.490.242.885.6571Gang·g-10.000.000.010.010.0085Rbng·g-10.010.060.070.070.2489Ypg·g-10.4312.4217.565.4261.1395Mopg·g-17.8623.4225.1517.4785.64118Snpg·g-115.2831.0220.2326.6136.75133Cspg·g-12.1412.8821.3211.2819.53137Bapg·g-1570.10818.44641.80874.29718.77232Thpg·g-10.393.603.602.6718.727Ling·g-10.040.030.120.030.3411Bng·g-10.204.7316.951.8865.49
注: 各冰川数据为其样品检测数据的平均值。
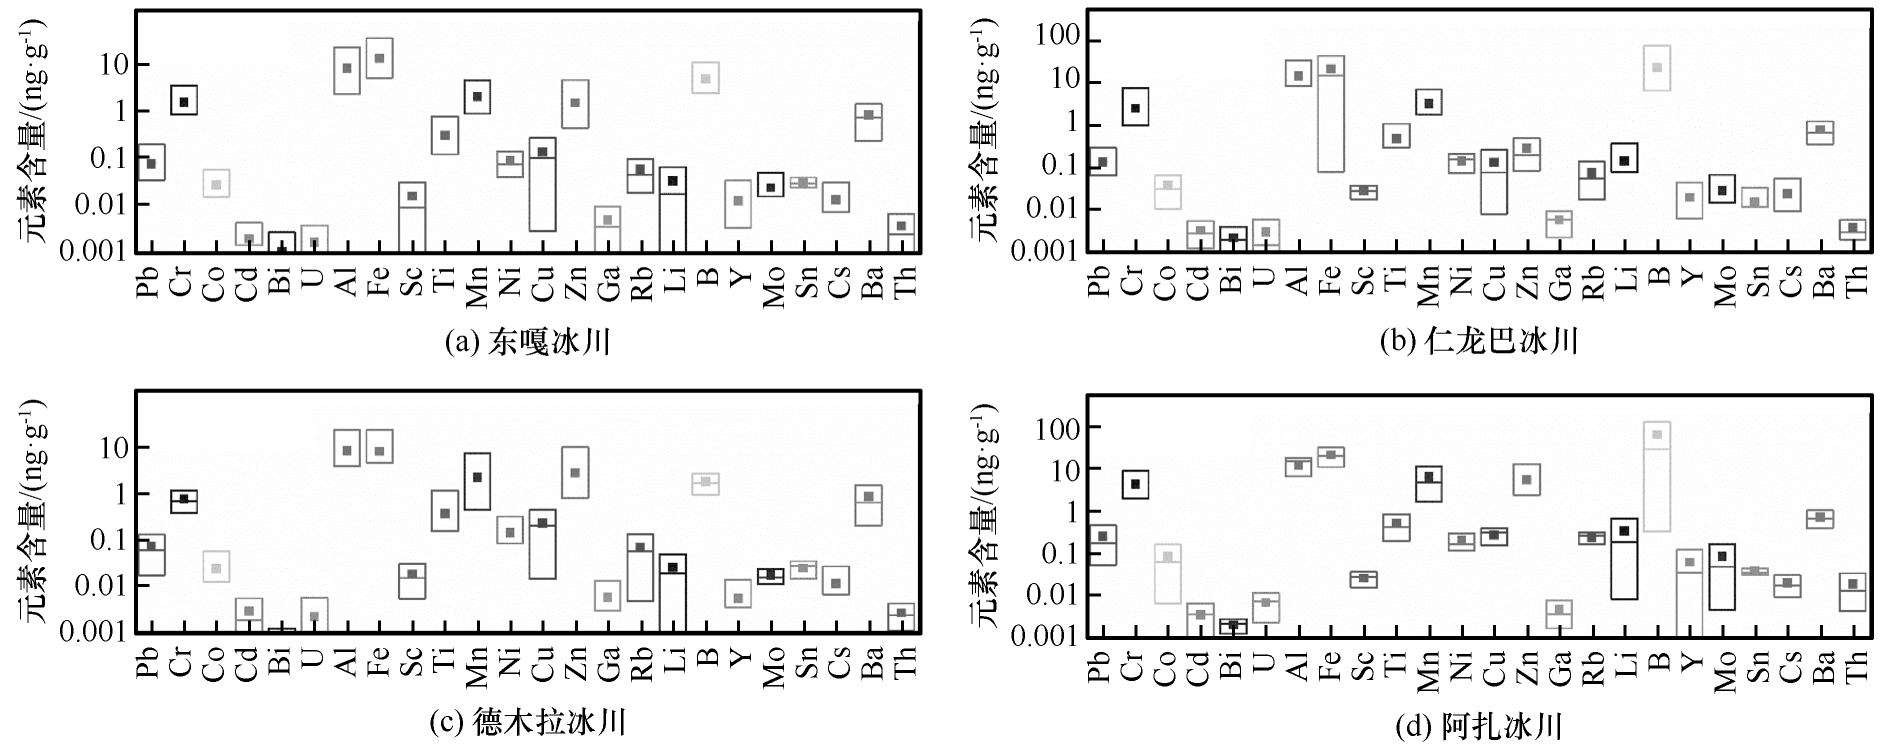
图2 藏东南地区东嘎(a)、 仁龙巴(b)、 德木拉(c)、 阿扎(d)冰川雪冰中元素平均含量
Fig.2 Mean concentrations of various elements in snowpit and surface snow/ice from Dongga (a), Renlongba (b),Demula (c) and Azha (d) Glaciers in the southeastern Tibetan Plateau
表3 藏东南雪冰Pb和Cd元素平均含量与其他地区对比
Table 3 Element concentrations of Pb and Cd in snowpit and surface snow/ice from the southeasternTibetan Plateau and other regions
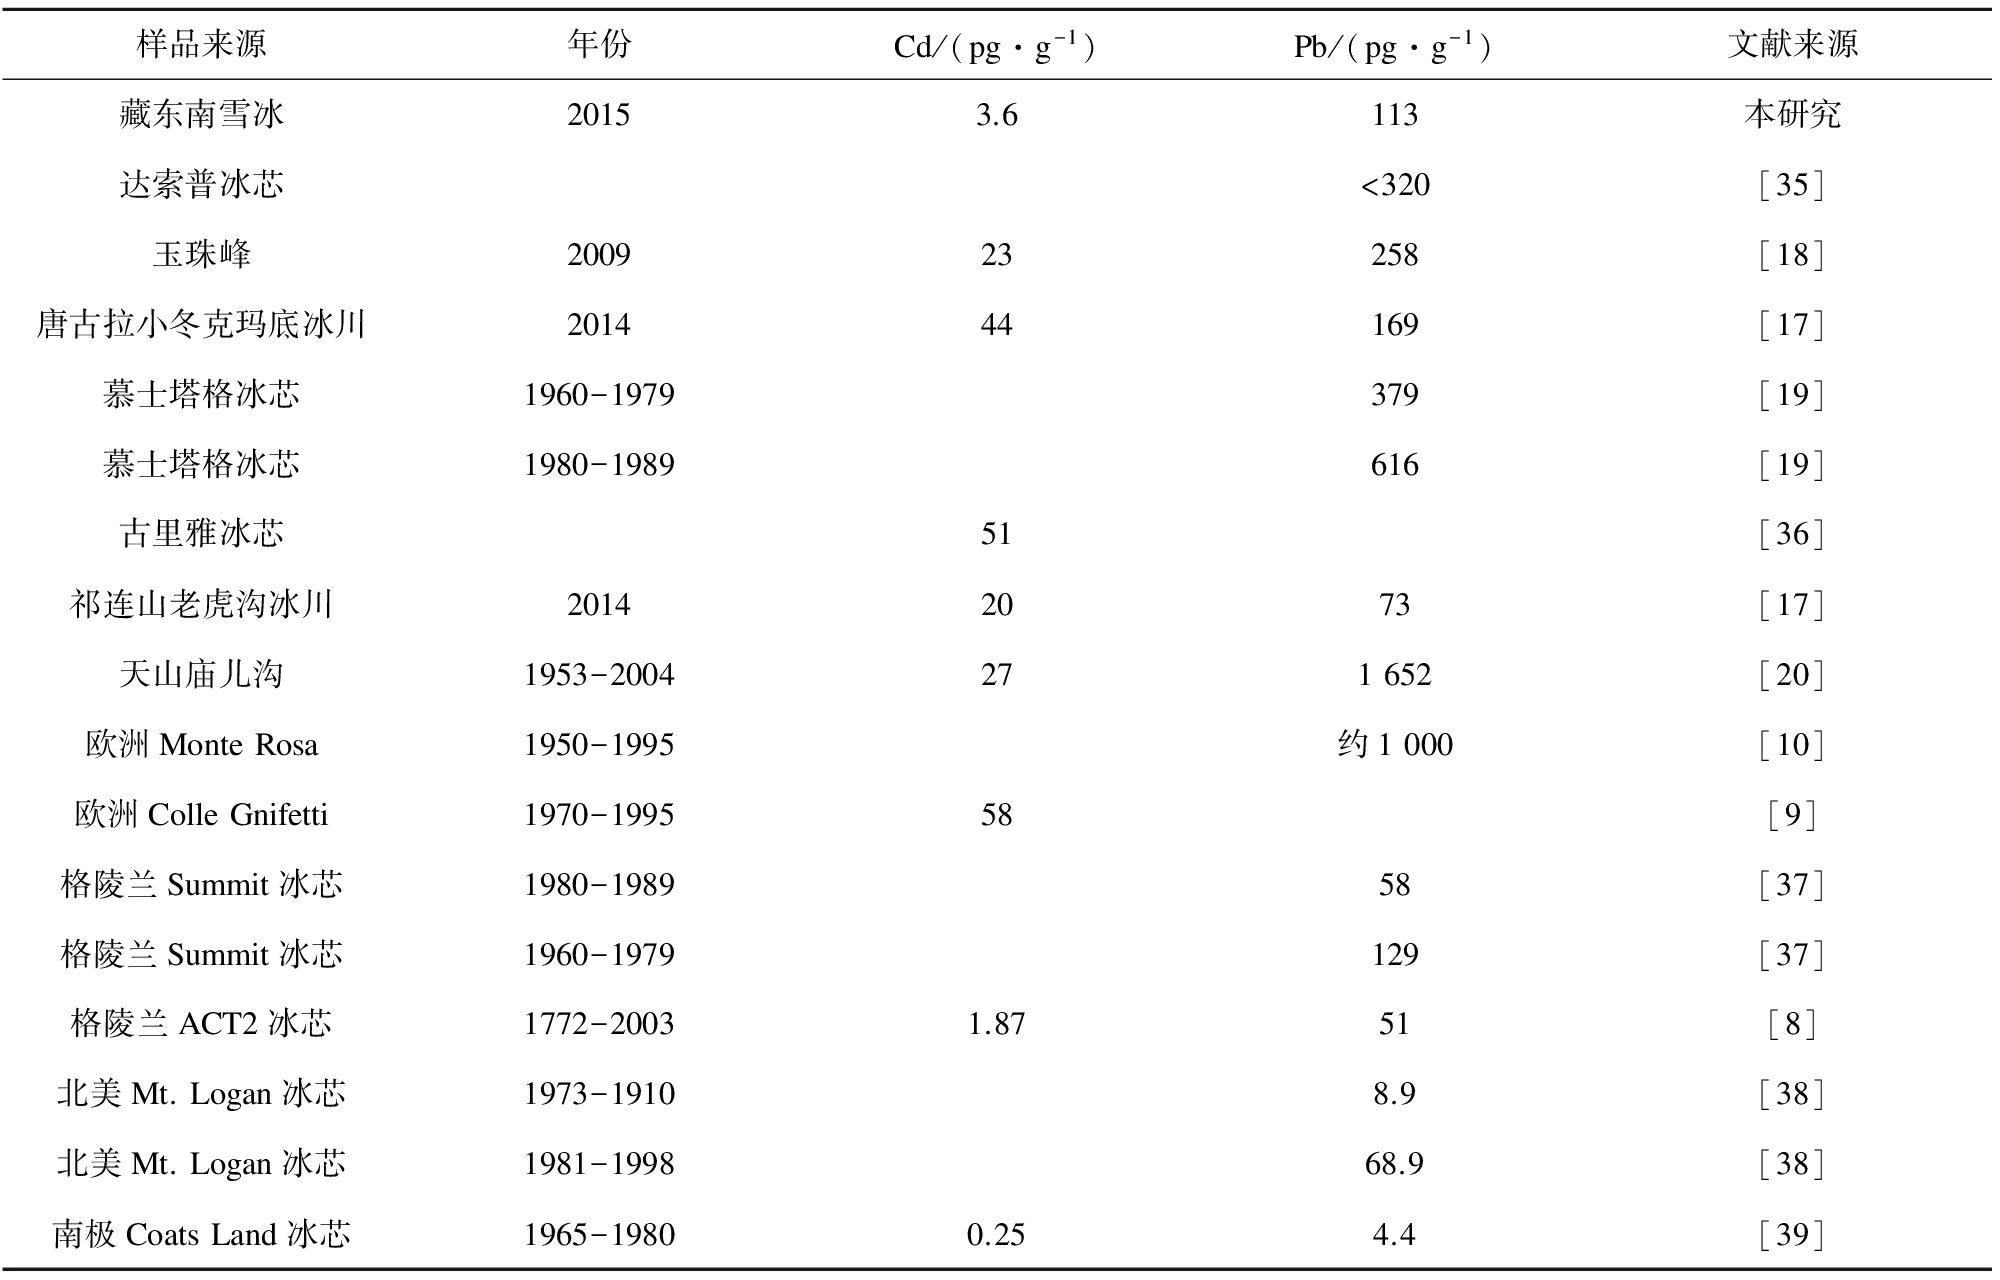
样品来源年份Cd/(pg·g-1)Pb/(pg·g-1)文献来源藏东南雪冰20153.6113本研究达索普冰芯<320[35]玉珠峰200923258[18]唐古拉小冬克玛底冰川201444169[17]慕士塔格冰芯1960-1979379[19]慕士塔格冰芯1980-1989616[19]古里雅冰芯51[36]祁连山老虎沟冰川20142073[17]天山庙儿沟1953-2004271652[20]欧洲MonteRosa1950-1995约1000[10]欧洲ColleGnifetti1970-199558[9]格陵兰Summit冰芯1980-198958[37]格陵兰Summit冰芯1960-1979129[37]格陵兰ACT2冰芯1772-20031.8751[8]北美Mt.Logan冰芯1973-19108.9[38]北美Mt.Logan冰芯1981-199868.9[38]南极CoatsLand冰芯1965-19800.254.4[39]
从全球范围来看, 藏东南地区雪冰中Pb和Cd含量, 显著低于人类活动强烈影响的欧洲阿尔卑斯山雪冰中Pb和Cd含量[9-10], 略高于格陵兰地区雪冰中Pb和Cd含量[37], 但显著高于更为偏远的南极地区雪冰中Pb和Cd含量[39]。尽管上述研究并没有区分自然源和人为源的贡献比例, 但不同地区冰川雪冰中Pb和Cd含量的变化反映出不同区域大气中Pb含量的差异。
2.2 富集因子分析
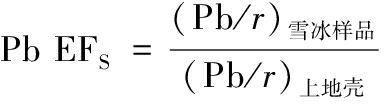
元素的富集因子(Enrichment Factors, EFs)是可以定量评估重金属污染程度的重要指标, 且比含量更能反映重金属污染的变化趋势[40]。样品中污染元素含量与参考元素含量的比值与上地壳两者含量比值的比率即为富集因子。以Pb为例, 富集因子Pb EFs定义为
(1)
式中: r为标准参考元素, 一般选取陆源粉尘元素Al作为参考元素。由于不同地区上地壳元素丰度存在区域差异, 故本文采用Li等[41]发表的青藏高原表层土壤元素数据作为标准代表上地壳元素含量, 并以Al作为参考元素, 以此计算藏东南雪冰中重金属元素的富集因子, 评估人类活动排放污染物对本地区环境的污染程度。若EFs值接近1, 表明陆源贡献为主; 若EFs值大于1, 表明人为源或除陆源粉尘来源外的其他自然源的影响较大; 一般认为, 当EFs值大于10时才认为元素受人类活动的影响而发生明显富集[40,42]。
藏东南雪冰中元素的富集因子结果(图3)表明, 不同元素EFs值相差很大, 最小的是Fe和Ti等代表陆源粉尘输入为主的元素。图中显示, EFs可分为两组, 即没有富集的元素, 如Fe、 Ti、 Mn等; 以及发生强烈富集的元素, 如Pb、 Cr、 Cd、 Cu、 Zn、 Mo、 Sn等, 其EFs值远大于10, 表明藏东南地区雪冰重金属元素的沉积受到人类活动排放污染物的显著影响。
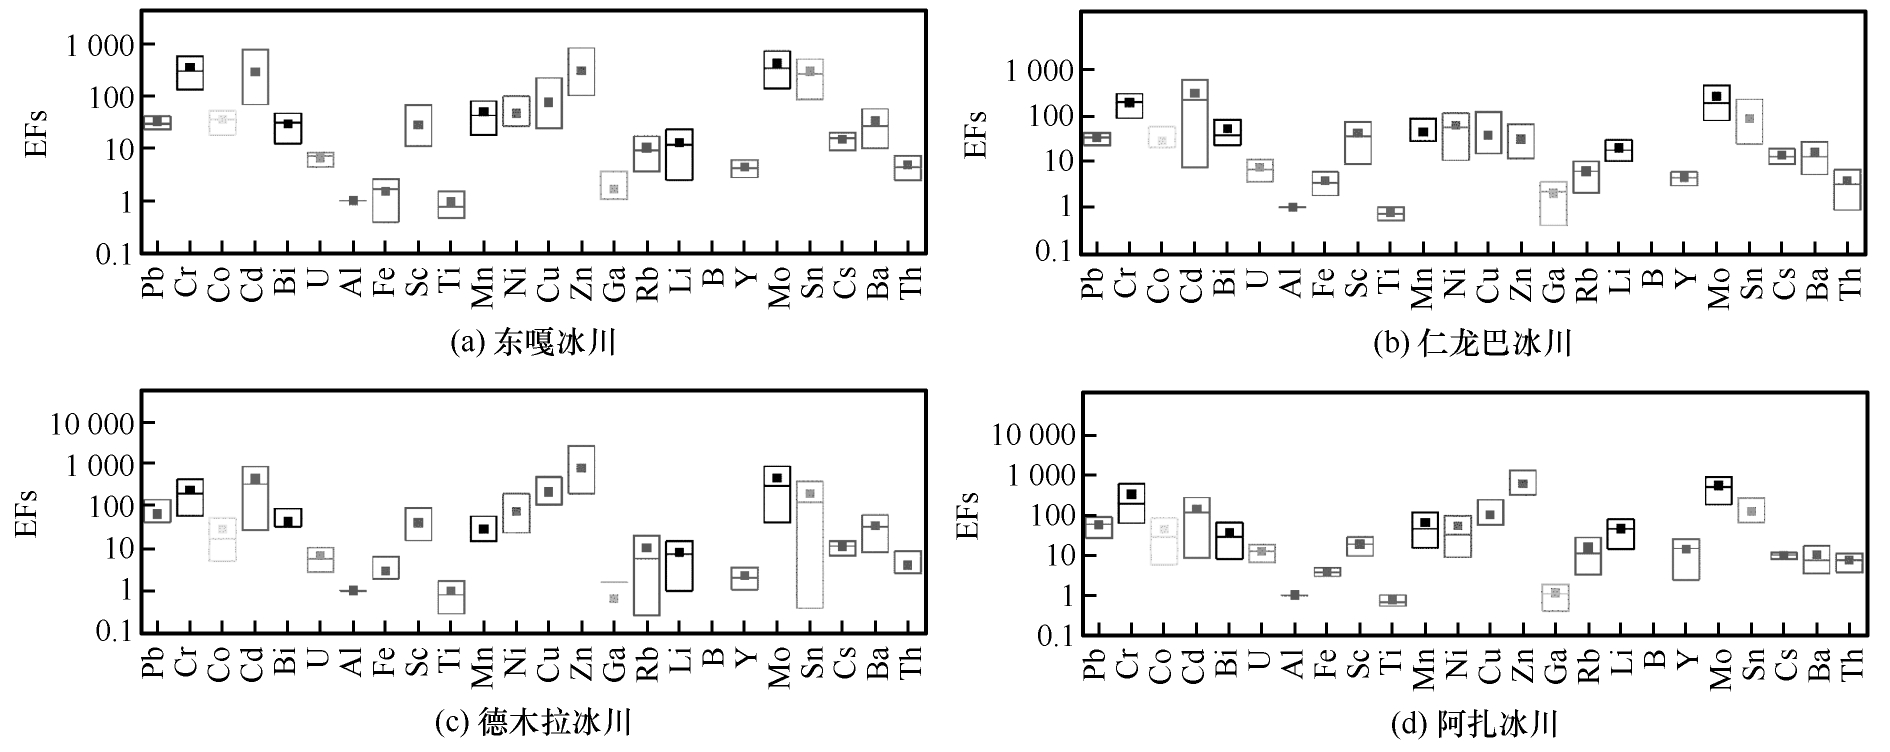
图3 藏东南地区东嘎(a)、 仁龙巴(b)、 德木拉(c)、 阿扎(d)冰川雪冰中元素平均富集因子
Fig.3 Mean enrichment factors of various elements in snowpit and surface snow/ice from Dongga (a), Renlongba (b),Demula (c) and Azha (d) Glaciers in the southeastern Tibetan Plateau
元素的EFs与标准参考元素含量(如Al)作对比, 如元素主要是陆源输入为主, 则二者呈水平直线变化, 否则富集元素的EFs值随Al含量增加而降低[34,43]。图4显示, EFs高值时对应于Al含量低值, 而EFs较低时对应于Al含量的高值, 即EFs值随Al含量的降低而显著升高, 说明Pb、 Cr、 Cd等元素主要来自人类活动排放重金属污染物的贡献。以地壳源为主的元素, 如Fe的EFs值基本小于10, 且随Al含量变化比较平稳。
2.3 主成分分析
主成分分析(Principal Component Analysis)是考察多个变量之间相关性的一种多元统计方法, 旨在利用降维的思想把多指标转化为少数几个综合指标[44]。藏东南雪冰中元素含量的主成分分析结果(表4)表明, 第一主成分(PCA1)载荷量为27%, 以Pb、 Cr等重金属元素为主。重金属元素Pb具有生物毒性且易于远距离传输, 大气Pb主要以大气颗粒物的形式赋存, 其来源主要有含铅汽油尾气排放、 燃煤排放、 有色金属冶炼、 垃圾焚烧处理等人为源, 以及土壤扬尘等少量的自然源[42,45]。自然界中Cr主要来源于土壤和岩石风化(占自然源的61.5%), 人为源主要是钢铁和有色金属冶炼、 煤和石油燃烧、 以及水泥生产等, Cr及其化合物均具有毒性[44]。PCA1主要反映了汽油和燃煤等人类活动排放的污染物对藏东南雪冰重金属元素的影响。
第二主成分(PCA2)占26%, 以陆源粉尘元素Al、 Fe、 Ti等为主, 反映了自然源粉尘输入对雪冰元素记录的影响。第三主成分(PCA3)占23%, 主要载荷有重金属元素Co、 Cd、 Ni等。其中, Cd有很大毒性, 20世纪60年代的日本“痛痛病”事件就是由Cd中毒而导致的, 含Cd的自然源粉尘主要与成土母质有关, 人为源Cd排放受燃煤、 电镀、 染料等行业的影响[42]。第四主成分(PCA4)仅占8%, 以Cu和Zn为主, 可能与钢铁铸造、 铜矿冶炼提纯等工业排放有关。上述各元素提取比例均大于60%。
图4 藏东南地区雪冰重金属元素富集因子与Al含量对比
Fig.4 Scatter plot of enrichment factors of various elements vs. Al concentrations in snowpit andsurface snow/ice from the southeastern Tibetan Plateau
2.4 来源探讨与潜在影响
藏东南地区夏季受南亚季风(即印度季风)的显著影响, 岗日嘎布山脉西侧的雅鲁藏布江河谷是印度洋和孟加拉湾水汽向青藏高原内部输送的主要通道[46]。藏东南地区位于南亚大气棕色云的北侧边缘, 已有的研究表明南亚地区排放的污染物可到达藏东南地区。Sheng等[47]分析藏东南大气气溶胶中的持久性有机污染物(POPs)发现, 印度季风对POPs向青藏高原的大气传输具有重要作用, 即藏东南地区大气环境受印度季风携带污染物的影响。该地区大气降水中显示人类活动来源(anthropogenic source, as)的![]() 和
和![]() 在冬春季呈高值, 认为与南亚地区生物质燃烧和化石燃料燃烧相关; 而夏季降水化学元素含量则与南亚地区工业排放相关[48]。该地区的后向气团轨迹也显示, 气团主要来自于印度西北部以及孟加拉湾[47-48]。以东嘎冰川为例, 采样期间每隔6 h的后向气团轨迹(图5, 源自http://www.arl.noaa.gov/HYSPLIT_info.php)显示, 气团主要来自印度北部地区。
在冬春季呈高值, 认为与南亚地区生物质燃烧和化石燃料燃烧相关; 而夏季降水化学元素含量则与南亚地区工业排放相关[48]。该地区的后向气团轨迹也显示, 气团主要来自于印度西北部以及孟加拉湾[47-48]。以东嘎冰川为例, 采样期间每隔6 h的后向气团轨迹(图5, 源自http://www.arl.noaa.gov/HYSPLIT_info.php)显示, 气团主要来自印度北部地区。
全球每年排放的Pb、 Cd、 Cr等分别为 119 259、 2 983和14 730 t, 其中亚洲地区排放量可占50%左右[44]。相对于大气环境较为洁净、 工业活动稀少的青藏高原, 南亚地区因持续的人口增长以及工农业的快速发展, 排放了大量的重金属污染物和碳质气溶胶。青藏高原南部冰川中主要污染物滴滴涕、 六六六和汞的高值均出现在20世纪70年代初期, 与此对应, 该时期印度曾大量使用这些污染物[49]。高原中部各拉丹冬冰芯记录重建过去500年来大气汞(Hg)沉降, 发现自20世纪50年代以来, 大气汞沉降通量快速升高, 约为工业革命前的3倍, 反映了亚洲区域尤其是南亚地区人类活动排放汞量的急剧增加对青藏高原环境的显著影响[50]。最新研究结果发现, 南亚地区排放的污染物可以通过喜马拉雅山一些南北向的山谷或直接由高空向青藏高原内陆传输[22-23]。藏东南雪冰富集因子分析发现, Pb、 Cr等元素呈显著富集状态, 而当地工业排放等污染源稀少, 结合主成分分析结果、 后向气团轨迹来源以及已有研究成果[49-51], 可见该地区雪冰元素含量不可避免地受到南亚地区人类活动排放污染物的显著影响。这也从侧面进一步表明, 南亚地区排放的重金属污染物能够显著影响藏东南地区冰川记录。
表4 藏东南雪冰重金属元素主成分分析
Table 4 Principal component analyses of elements records in snowpit and surface snow/ice from the southeastern Tibetan Plateau
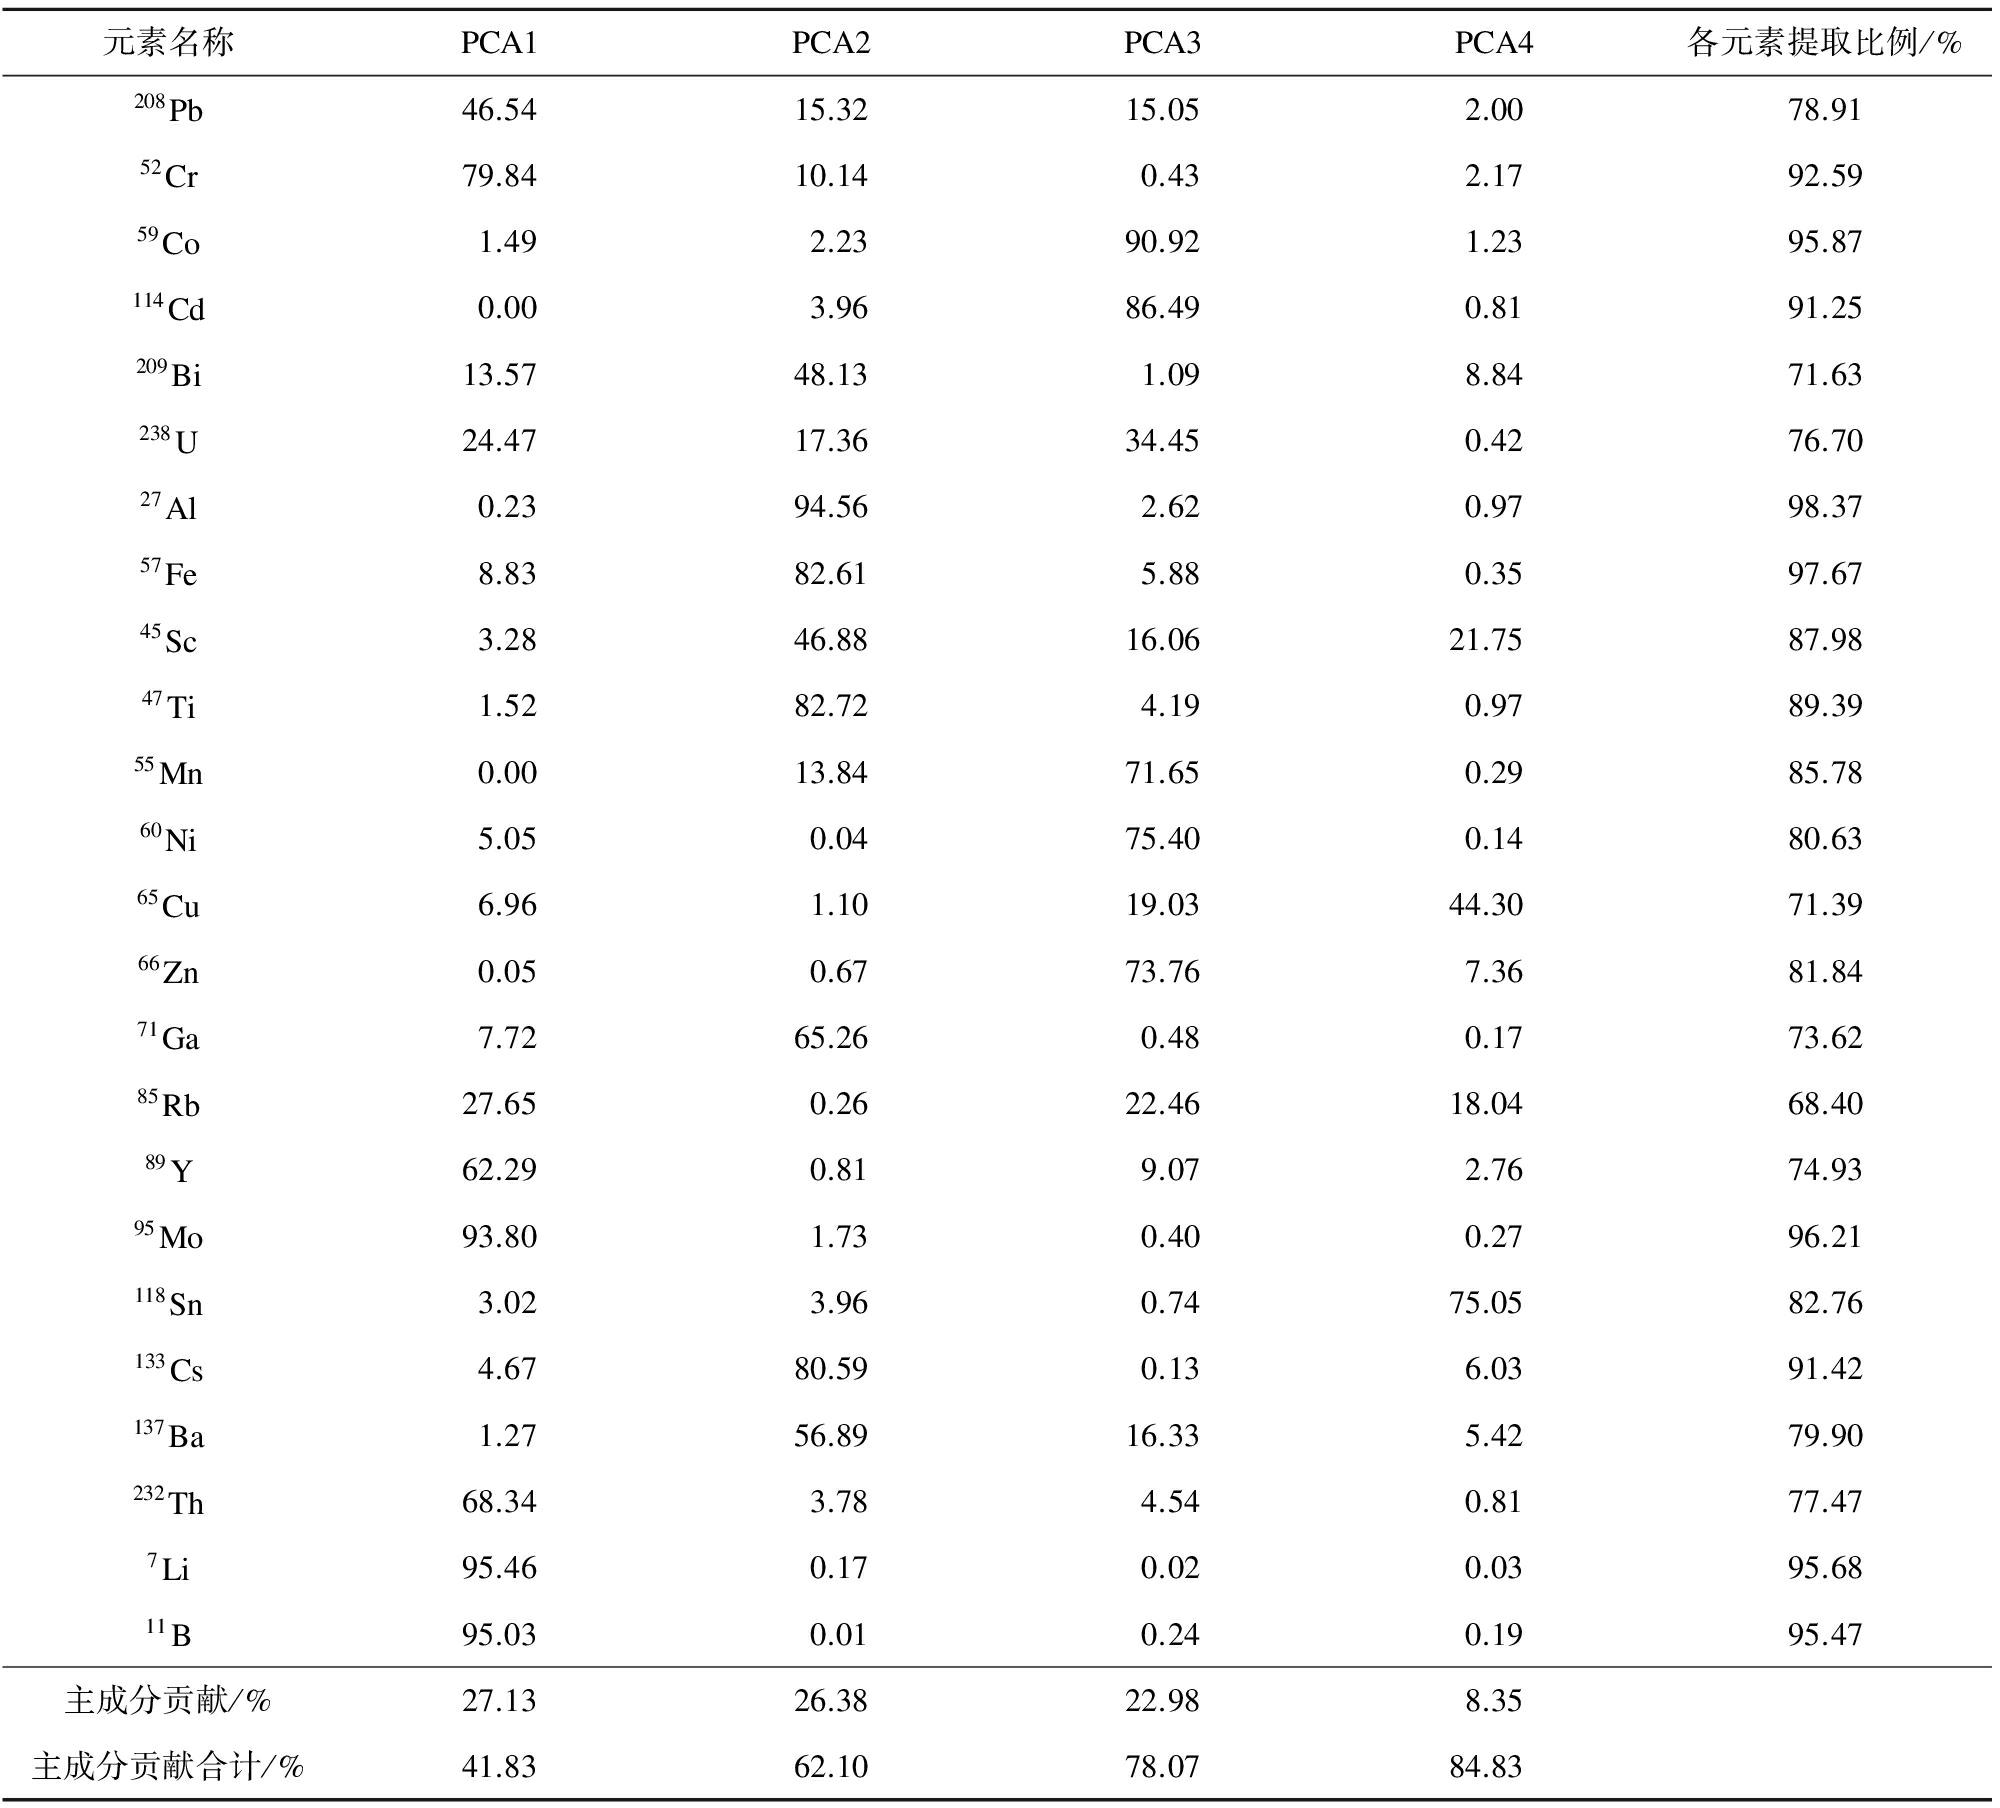
元素名称PCA1PCA2PCA3PCA4各元素提取比例/%208Pb46.5415.3215.052.0078.9152Cr79.8410.140.432.1792.5959Co1.492.2390.921.2395.87114Cd0.003.9686.490.8191.25209Bi13.5748.131.098.8471.63238U24.4717.3634.450.4276.7027Al0.2394.562.620.9798.3757Fe8.8382.615.880.3597.6745Sc3.2846.8816.0621.7587.9847Ti1.5282.724.190.9789.3955Mn0.0013.8471.650.2985.7860Ni5.050.0475.400.1480.6365Cu6.961.1019.0344.3071.3966Zn0.050.6773.767.3681.8471Ga7.7265.260.480.1773.6285Rb27.650.2622.4618.0468.4089Y62.290.819.072.7674.9395Mo93.801.730.400.2796.21118Sn3.023.960.7475.0582.76133Cs4.6780.590.136.0391.42137Ba1.2756.8916.335.4279.90232Th68.343.784.540.8177.477Li95.460.170.020.0395.6811B95.030.010.240.1995.47主成分贡献/%27.1326.3822.988.35主成分贡献合计/%41.8362.1078.0784.83
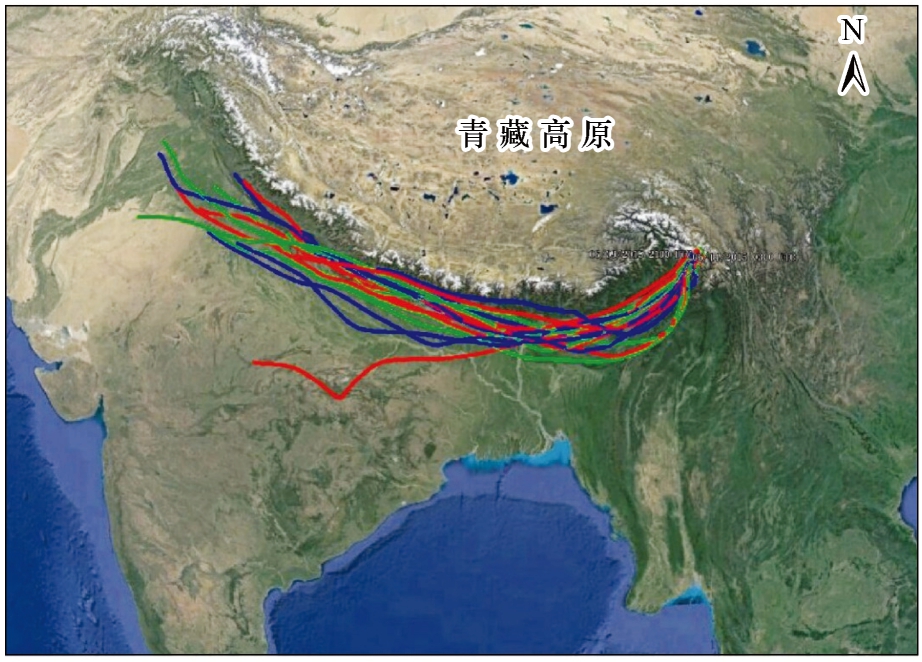
图5 藏东南东嘎冰川采样点气团7天后向轨迹
Fig.5 Seven-days backward air mass trajectories over theDongga Glacier in the southeastern Tibetan Plateau
目前, 藏东南地区冰川呈显著退缩状态[24,32-33,52-53], 如阿扎冰川1980-2006年的退缩速率为65 m·a-1, 德木拉冰川2006-2008年的退缩速率为5.5 m·a-1。如此强烈的冰川消融可释放大量的重金属元素进入河流, 可能对下游地区的人类生产生活以及生态系统产生重要影响[21,25]。过去40年来, 青藏高原以及周边地区冰川损失量可达500 km3[54], 雪冰中Pb和Cd的平均含量为113 pg·g-1和3.6 pg·g-1(表3), 估算表明过去40年来约有550 t的Pb和20 t的Cd从冰川释放并进入到下游的生态系统。随着冰川消融的加速[24,33], 冰川融水对河水径流的贡献具有重要影响[25], 进而影响到下游生态系统。
3 结论
2015年6月在藏东南地区采集了4条冰川的雪坑以及表层雪冰样品, 并分析了元素含量。结果显示, Pb、 Cd等重金属元素含量与高原其他地区雪冰中元素含量相比偏低, 显著低于天山和阿尔卑斯山雪冰中Pb和Cd含量, 略高于格陵兰、 加拿大北极地区雪冰中Pb和Cd含量, 但显著高于南极地区雪冰中Pb和Cd含量。这表明藏东南雪冰中元素含量仍代表全球背景地区含量水平。
藏东南雪冰元素富集因子结果表明, EFs可分为两组, 即没有富集的元素, 如Fe、 Ti、 Mn等; 以及发生强烈富集的元素, 如Pb、 Cr、 Cd、 Cu、 Zn、 Mo、 Sn等, 表明藏东南地区雪冰重金属元素的沉积受到人类活动排放污染物的显著影响。主成分分析也表明, 不同重金属元素的污染来源存在差异, 如Pb等主要来源于含铅汽油尾气排放、 燃煤排放等, Cu和Zn可能与钢铁铸造以及铜矿冶炼等有关。并且, 重金属元素如Pb、 Cr、 Cd、 Cu、 Zn等的EFs值随着Al含量的降低而显著增加, 进一步表明这些元素主要受到人类活动排放污染物的影响。结合后向气团轨迹分析, 推断藏东南地区雪冰元素含量不可避免地受到南亚地区人类活动的显著影响。在冰川消融的情景下, 重金属元素释放并进入河流, 将会对下游生态系统产生重要影响。
参考文献(References):
[1] Eichler A, Tobler L, Eyrikh S, et al. Ice-core based assessment of historical anthropogenic heavy metal (Cd, Cu, Sb, Zn) emissions in the Soviet Union[J]. Environmental Science & Technology, 2014, 48: 2635-2642.
[2] Tuohy A, Bertler N, Neff P, et al. Transport and deposition of heavy metals in the Ross Sea Region, Antarctica[J]. Journal of Geophysical Research: Atmospheres, 2015, 120(20): 10996-11011.
[3] Singh S M, Sharma J, Gawas-Sakhalkar P, et al. Atmospheric deposition studies of heavy metals in Arctic by comparative analysis of lichens and cryoconite[J]. Environmental Monitoring and Assessment, 2013, 185: 1367-1376.
[4] Zhang Qianggong, Pan Ke, Kang Shichang, et al. Mercury in wild fish from high-altitude aquatic ecosystems in the Tibetan Plateau[J]. Environmental Science & Technology, 2014, 48: 5220-5228.
[5] Allan R. Atmospheric mercury contamination of remote aquatic ecosystems in Canada[J]. Water Science and Technology, 1999, 39: 173-177.
[6] Hong Sungmin, Candelone J-P, Soutif M, et al. A reconstruction of changes in copper production and copper emissions to the atmosphere during the past 7000 years[J]. Science of the Total Environment, 1996, 188: 183-193.
[7] Hong Sungmin, Lee Khanghyun, Hou Shugui, et al. An 800-year record of atmospheric As, Mo, Sn, and Sb in central Asia in high-altitude ice cores from Mt. Qomolangma (Everest), Himalayas[J]. Environmental Science & Technology, 2009, 43(21): 8060-8065.
[8] McConnell J R, Edwards R. Coal burning leaves toxic heavy metal legacy in the Arctic[J]. Proceedings of the National Academy of Sciences, 2008, 105: 12140-12144.
[9] Barbante C, Schwikowski M, Döring T, et al. Historical record of European emissions of heavy metals to the atmosphere since the 1650s from Alpine snow/ice cores drilled near Monte Rosa[J]. Environmental Science & Technology, 2004, 38(15): 4085-4090.
[10] Schwikowski M, Barbante C, Doering T, et al. Post-17th-century changes of European lead emissions recorded in high-altitude alpine snow and ice[J]. Environmental Science & Technology, 2004, 38: 957-964.
[11] Kang Shichang, Zhang Qianggong, Kaspari S, et al. Spatial and seasonal variations of elemental composition in Mt. Everest (Qomolangma) snow/firn[J]. Atmospheric Environment, 2007, 41: 7208-7218.
[12] Wolff E W, Suttie E D. Antarctic snow record of southern hemisphere lead pollution[J]. Geophysical Research Letters, 1994, 21: 781-784.
[13] Boutron C, Barbante C, Hong S, et al. Heavy metals in Antarctic and Greenland snow and ice cores: man induced changes during the last millennia and natural variations during the last climatic cycles[M]// Quante M, Ebinghaus R, Flöser G. Persistent pollution: past, present and future. Berlin: Springer, 2011: 19-46.
[14] Gabrieli J, Barbante C. The Alps in the age of the Anthropocene: the impact of human activities on the cryosphere recorded in the Colle Gnifetti glacier[J]. Rendiconti Lincei, 2014, 25: 71-83.
[15] Yao Tandong, Thompson L G, Mosbrugger V, et al. Third pole environment (TPE)[J]. Environmental Development, 2012, 3: 52-64.
[16] Kaspari S, Mayewski P A, Handley M, et al. Recent increases in atmospheric concentrations of Bi, U, Cs, S and Ca from a 350-year Mount Everest ice core record[J/OL]. Journal of Geophysical Research: Atmospheres, 2009, 114(D4). [2017-11-25]. http://onlinelibrary.wiley.com/doi/10.1029/2008JD011088/abstract.
[17] Dong Zhiwen, Kang Shichang, Qin Xiang, et al. New insights into trace elements deposition in the snow packs at remote alpine glaciers in the northern Tibetan Plateau, China[J]. Science of the Total Environment, 2015, 529: 101-113.
[18] Li Yuefang, Shi Xiaolan, Wang Ninglian, et al. Concentration of trace elements and their sources in a snow pit from Yuzhu Peak, north-east Qinghai-Tibetan Plateau[J]. Sciences in Cold and Arid Regions, 2011, 3(3): 216-222.
[19] Li Zhen, Yao Tandong, Tian Lide, et al. Atmospheric Pb variations in central Asia since 1955 from Muztagata ice core record, eastern Pamirs[J]. Chinese Science Bulletin, 2006, 51(16): 1996-2000. [李真, 姚檀栋, 田立德, 等. 慕士塔格冰芯记录的近50年来大气中铅含量变化[J]. 科学通报, 2006, 51(15): 1833-1836.]
[20] Liu Yaping, Hou Shugui, Hong Sungmin, et al. High-resolution trace element records of an ice core from the eastern Tien Shan, central Asia, since 1953 AD[J/OL]. Journal of Geophysical Research: Atmospheres, 2011, 116(D2). [2017-11-25]. http://onlinelibrary.wiley.com/doi/10.1029/2010JD015191/full.
[21] Zhang Qianggong, Huang Jie, Wang Feiyue, et al. Mercury distribution and deposition in glacier snow over western China[J]. Environmental Science & Technology, 2012, 46: 5404-5413.
[22] Cong Zhiyuan, Kawamura K, Kang Shichang, et al. Penetration of biomass-burning emissions from South Asia through the Himalayas: new insights from atmospheric organic acids[J/OL]. Scientific Reports, 2015, 5. [2017-11-25]. https://www.nature.com/articles/srep09580.
[23] Lüthi Z, Skerlak B, Kim S, et al. Atmospheric brown clouds reach the Tibetan Plateau by crossing the Himalayas[J]. Atmospheric Chemistry and Physics, 2015, 15: 6007-6021.
[24] Yao Tandong, Thompson L G, Yang Wei, et al. Different glacier status with atmospheric circulations in Tibetan Plateau and surroundings[J]. Nature Climate Change, 2012, 2: 663-667.
[25] Immerzeel W W, van Beek L P, Bierkens M F. Climate change will affect the Asian water towers[J]. Science, 2010, 328: 1382-1385.
[26] Yanai M, Wu Guoxiong. Effects of the Tibetan Plateau[M]// Wang Bin. The Asian monsoon. Berlin: Springer, 2006: 513-549.
[27] Lin Zhenyao, Wu Xiangding. Climate division of the Tibetan Plateau[J]. Acta Geographica Sinica, 1981, 36(1): 22-32. [林振耀, 吴祥定. 青藏高原气候区划[J]. 地理学报, 1981, 36(1): 22-32.]
[28] You Qinglong, Fraedrich K, Ren Guoyu, et al. Inconsistencies of precipitation in the eastern and central Tibetan Plateau between surface adjusted data and reanalysis[J]. Theoretical and Applied Climatology, 2012, 109: 485-496.
[29] You Qinglong, Kang Shichang, Pepin N, et al. Relationship between temperature trend magnitude, elevation and mean temperature in the Tibetan Plateau from homogenized surface stations and reanalysis data[J]. Global and Planetary Change, 2010, 71: 124-133.
[30] Liu Bin, Kang Shichang, Sun Jimin, et al. Low-molecular-weight organic acids in the Tibetan Plateau: results from one-year of precipitation samples at the SET station[J]. Atmospheric Environment, 2014, 86: 68-73.
[31] Wang Yongjie, Ma Yaoming, Zhu Zhikun, et al. Variation characteristics of meteorological elements in near surface layer over the Lulang valley of southeastern Tibetan Plateau[J]. Plateau Meteorology, 2010, 29(1): 63-69. [王永杰, 马耀明, 朱志鹍, 等. 藏东南地区鲁朗河谷近地层气象要素变化特征[J]. 高原气象, 2010, 29(1): 63-69.]
[32] Yang Wei, Guo Xiaofeng, Yao Tandong, et al. Recent accelerating mass loss of southeast Tibetan glaciers and the relationship with changes in macroscale atmospheric circulations[J]. Climate Dynamics, 2016, 47(3/4): 805-815.
[33] Yang Wei, Yao Tandong, Xu Baiqing, et al. Characteristics of recent temperate glacier fluctuations in the Parlung Zangbo River basin, southeast Tibetan Plateau[J]. Chinese Science Bulletin, 2010, 55(20): 2097-2102. [杨威, 姚檀栋, 徐柏青, 等. 近期藏东南帕隆藏布流域冰川的变化特征[J]. 科学通报, 2010, 55(18): 1775-1780.]
[34] Cong Zhiyuan, Kang Shichang, Zhang Yulan, et al. Atmospheric wet deposition of trace elements to central Tibetan Plateau[J]. Applied Geochemistry, 2010, 25: 1415-1421.
[35] Huo Wenmian, Yao Tandong, Li Yuefang. The record of lead pollution and its isotopic evidence in Dasuopu ice core[J]. Journal of Glaciology and Geocryology, 1999, 21(2): 125-128. [霍文冕, 姚檀栋, 李月芳. 达索普冰芯中Pb记录反映的大气污染及其同位素证据[J]. 冰川冻土, 1999, 21(2): 125-128.]
[36] Li Yuefang, Yao Tandong. Atmospheric pollution revealed by cademium in the Guliya ice core, Qianhai-Tibet Plateau[J]. Environmental Chemistry, 2000, 19(2): 176-180. [李月芳, 姚檀栋. 青藏高原古里雅冰芯中痕量元素镉记录的大气污染: 1900-1991[J]. 环境化学, 2000, 19(2): 176-180.]
[37] Boutron C F, Candelone J-P, Hong S. Past and recent changes in the large-scale tropospheric cycles of lead and other heavy metals as documented in Antarctic and Greenland snow and ice: a review[J]. Geochimica et Cosmochimica Acta, 1994, 58: 3217-3225.
[38] Osterberg E, Mayewski P, Kreutz K, et al. Ice core record of rising lead pollution in the North Pacific atmosphere[J/OL]. Geophysical Research Letters, 2008, 35(5). [2017-11-25]. http://onlinelibrary.wiley.com/doi/10.1029/2007GL032680/abstract.
[39] Planchon O, Darboux F. A fast, simple and versatile algorithm to fill the depressions of digital elevation models[J]. Catena, 2002, 46: 159-176.
[40] Reimann C, de Caritat P. Distinguishing between natural and anthropogenic sources for elements in the environment: regional geochemical surveys versus enrichment factors[J]. Science of the Total Environment, 2005, 337: 91-107.
[41] Li Chaoliu, Kang Shichang, Zhang Qianggong. Elemental composition of Tibetan Plateau top soils and its effect on evaluating atmospheric pollution transport[J]. Environmental Pollution, 2009, 157: 2261-2265.
[42] Robert E L, Jr, Wu Decai. The sources of heavy metals in the atmospheric pollutants[J]. Foreign Medical: Hygiene, 1983(6): 342-347. [Robert E L, Jr, 吴德才. 大气中污染环境的重要金属来源[J]. 国外医学: 卫生学分册, 1983(6): 342-347.]
[43] Al-Momani I. Trace elements in atmospheric precipitation at Northern Jordan measured by ICP-MS: acidity and possible sources[J]. Atmospheric Environment, 2003, 37: 4507-4515.
[44] Pacyna J M, Pacyna E G. An assessment of global and regional emissions of trace metals to the atmosphere from anthropogenic sources worldwide[J]. Environmental Reviews, 2001, 9: 269-298.
[45] Pacyna J M, Pacyna E G, Aas W. Changes of emissions and atmospheric deposition of mercury, lead, and cadmium[J]. Atmospheric Environment, 2009, 43: 117-127.
[46] Gao Dengyi. A study on the Brahmaptra water vapor channel[J]. Chinese Journal of Nature, 2008, 30(5): 301-303. [高登义. 雅鲁藏布江水汽通道考察研究[J]. 自然杂志, 2008, 30(5): 301-303.]
[47] Sheng Jiujiang, Wang Xiaoping, Gong Ping, et al. Monsoon-driven transport of organochlorine pesticides and polychlorinated biphenyls to the Tibetan Plateau: three year atmospheric monitoring study[J]. Environmental Science & Technology, 2013, 47: 3199-3208.
[48] Liu Bin, Kang Shichang, Sun Jimin, et al. Wet precipitation chemistry at a high-altitude site (3,326 m asl) in the southeastern Tibetan Plateau[J]. Environmental Science and Pollution Research, 2013, 20: 5013-5027.
[49] Wang Xiaoping, Yao Tandong, Wang Pengling, et al. The recent deposition of persistent organic pollutants and mercury to the Dasuopu glacier, Mt. Xixiabangma, central Himalayas[J]. Science of the Total Environment, 2008, 394: 134-143.
[50] Kang Shichang, Huang Jie, Wang Feiyue, et al. Atmospheric mercury depositional chronology reconstructed from lake sediments and ice core in the Himalayas and Tibetan Plateau[J]. Environemtal Science and Technology, 2016, 50(6): 2859-2869.
[51] Zhang Yulan, Kang Shichang, Zhang Qianggong, et al. Chemical records in snowpits from high altitude glaciers in the Tibetan Plateau and its surroundings[J/OL]. PLOS ONE, 2016, 11(5). [2017-11-25]. http://journals.plos.org/plosone/article?id=10.1371/journal.pone.0155232.
[52] Liu Kai, Wang Ninglian, Bai Xiaohua. Variation of glaciers in the Nubra basin, Karakoram Mountains, revealed by remote sensing images during 1993-2015[J]. Journal Glaciology and Geocryology, 2017, 39(4): 710-719. [刘凯, 王宁练, 白晓华. 1993-2015年喀喇昆仑山努布拉流域冰川变化遥感监测[J]. 冰川冻土, 2017, 39(4): 710-719.]
[53] Wu Kunpeng, Liu Shiyin, Bao Weijia, et al. Remote sensing monitoring of the glacier in the Gangrigabu Range, southeast Tibetan Plateau from 1980 through 2015[J]. Journal of Glaciology and Geocryology, 2017, 39(1): 24-34. [吴坤鹏, 刘时银, 鲍伟佳, 等. 1980-2015年青藏高原东南部岗日嘎布山冰川变化的遥感监测[J]. 冰川冻土, 2017, 39(1): 24-34.]
[54] Yao Tandong, Wang Youqing, Liu Shiyin, et al. Recent glacial retreat in High Asia in China and its impact on water resource in Northwest China[J]. Science in China: Series D Earth Sciences, 2004, 47(12): 1065-1075. [姚檀栋, 刘时银, 蒲健辰, 等. 高亚洲冰川的近期退缩及其对西北水资源的影响[J]. 中国科学: D辑 地球科学, 2004, 34(6): 535-543.]
Characteristics of heavy metal elements deposited on glaciers in the southeastern Tibetan Plateau
Abstract: Atmospheric heavy metal elements can be preserved in snow and ice. Based on the snowpit and surface snow/ice samples collected from glaciers in the southeastern Tibetan Plateau during June 2015, elements concentrations were analyzed and discussed. The results indicate that the concentrations of heavy metal elements, such as Pb and Cd, are a little lower than that recorded in snow/ice in other regions of the Tibetan Plateau, and much lower than that in Tianshan Mountains and European Alps; they are comparable to that in Greenland and Canadian Arctic, while much higher than that in Antarctica. These results suggest that element concentrations in snow/ice in the southeastern Tibetan Plateau can represent atmospheric conditions in the background of the remote area. The enrichment factors show that elements such as Pb, Cr, Cd, Cu, Zn, Mo and Sn had strongly enriched with EFs>10, while crustal elements such as Fe, Ti, Mn and Th had enriched weakly. Principal component analysis suggests that there were different sources of pollution among different heavy metal elements. Using backward trajectories analysis, it is revealed that the anthropogenic emissions from South Asia had paid a significant role on the heavy metal element enrichment recorded on the glacier snow/ice. Nowadays, glaciers on the plateau are retreating rapidly, causing abundant heavy metal elements releasing from glacier meltwater flowing into the rivers, which may profoundly affect the human life, industrial activities and ecosystem in the downstream regions.
Key words: heavy metal elements; glacier; snow and ice samples; anthropogenic activity; Tibetan Plateau
(本文编辑: 武俊杰)
收稿日期: 2015-12-14;
修订日期:2017-08-08
基金项目: 国家自然科学基金项目(41671067; 41630754; 41721091); 冰冻圈科学国家重点实验室自主项目(SKLCS-ZZ-2017); 中国科学院西北生态环境资源研究院青年基金项目(张玉兰)资助
DOI: 10.7522 /j.issn.1000-0240.2017.0133
中图分类号: P343.6
文献标志码:A
文章编号:1000-0240(2017)06-1200-12